

When teams evaluate eCommerce reporting tools, they compare features, integrations, and dashboard designs. The more costly problem is the one that never appears on a comparison table — the hours your team burns every week making three reports agree before anyone can make a single decision. An insightsoftware study found that 69% of finance leaders spend at least five hours per week just re-creating reports, and 58% spend five or more hours transferring data between systems. This is what we call a foundation gap: every platform defines the same metrics differently, and no amount of dashboard layering fixes the disconnect.
That disconnect is what separates lightweight reporting from a real reporting architecture. The brands that scale are the ones where marketing, finance, operations, and leadership all work from the same underlying definitions. This guide breaks down where eCommerce reporting stacks fail, what strong reporting looks like across teams, and which tools solve which problems best in 2026.
Is your data actually Decision-Grade?
9 questions. 3 minutes. Score your Profitability Visibility and Readiness for AI-driven growth.
Start Free Diagnostic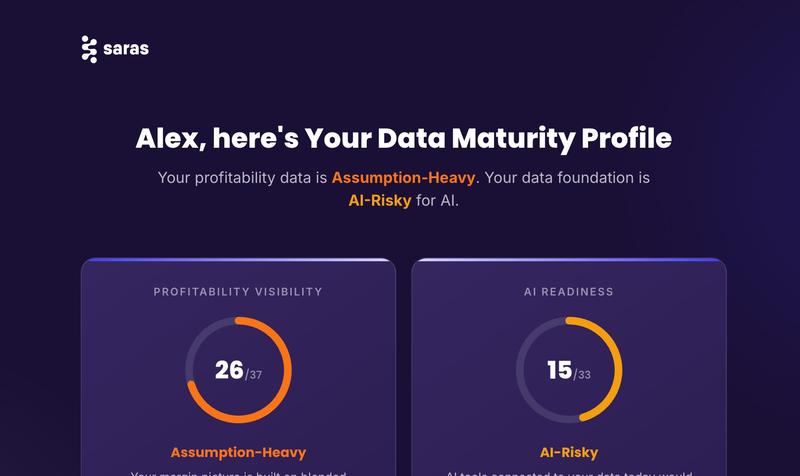
What eCommerce Reporting Tools Do and Why Most Stacks Break
An eCommerce reporting tool collects data from your store, ad platforms, and operational systems, organizes it against a set of KPIs, and presents it in dashboards or scheduled reports. The promise is simple: one place for your numbers.
The reality for most brands past $5M in revenue is that they end up with four or five reporting tools, each telling a slightly different version of the same story. The fragmentation is not random. It follows three predictable fault lines.
1. Different Definitions of the Same Metric
"Revenue" in Shopify includes taxes and shipping in gross figures. "Revenue" in Meta counts every attributed conversion at full order value, regardless of returns. "Revenue" in the CFO's P&L is net of returns, discounts, and chargebacks. Three tools, three numbers, same week.
As Ben Yahalom, CEO of True Classic, put it: "Before Saras, our P&L was built on estimates and pieced together from various tools."
This is the definitions problem, and it is the root of almost every reconciliation headache in eCommerce. Adding another dashboard on top of inconsistent definitions just produces a more polished version of the same confusion.
2. Incomplete Data Coverage
A reporting tool that reads Shopify and Meta but misses Amazon, your 3PL invoices, your ERP, and your subscription platform is producing reports with systematic gaps. The dangerous part is that these reports still look complete. They have charts, KPIs, and trendlines. They just do not include the cost data that determines whether the revenue they are showing you was actually profitable.
3. No Shared Semantic Layer
When marketing pulls from Triple Whale, finance pulls from NetSuite, and operations pulls from a spreadsheet fed by the 3PL portal, there is no shared definition layer underneath. Each team is interpreting the business through whichever tool they happen to trust. An AI-ready data foundation with a certified semantic layer is what makes "contribution margin" or "new customer" mean the same thing regardless of who opens the report.
A 2025 insightsoftware report found that 93% of finance teams are struggling with poor data management, with data accuracy (35%) and market uncertainty (36%) cited as the biggest challenges during planning and budgeting cycles. The definitions problem is a significant driver of that accuracy gap.
How ECommerce Reporting Stacks Work in 2026
eCommerce brands run a reporting stack made up of multiple layers: attribution tools, analytics platforms, BI systems, KPI dashboards, and increasingly, unified operating layers that combine all of them into one semantic model.
The challenge is that each layer solves a different problem. A tool that excels at ad attribution may be weak at profitability reporting. A BI platform may support sophisticated modeling but require a dedicated analytics team to maintain. Understanding which layer you are buying is more important than comparing dashboard features.
| Reporting Layer | Primary Question It Answers | Core Strength | Common Limitation | Platforms |
|---|---|---|---|---|
| Attribution Layer | Which channels drove conversions? | ROAS, CAC, media attribution, creative analytics | Weak finance and operational visibility | Triple Whale |
| KPI Dashboard Layer | How do teams monitor performance in real time? | Fast dashboard creation, KPI tracking, executive visibility | Limited modeling and eCommerce-specific depth | Databox |
| Cross-Channel Analytics Layer | How are channels, cohorts, and retention performing together? | Unified eCommerce analytics across platforms | Limited semantic governance and customization | Polar Analytics |
| BI & Semantic Modeling Layer | How do we standardize business definitions across reporting? | Custom modeling, governance, warehouse-native analytics | Requires engineering and analytics ownership | Looker |
| Unified Operating Layer | How do all teams work from the same trusted data? | Cross-functional reporting, contribution margin visibility, AI on certified data | Higher implementation scope than point solutions | Saras iQ |
What Good eCommerce Reporting Covers, by Team
Good eCommerce reporting is more like an architecture where each team gets the view they need to make their specific decisions, all pulling from the same underlying data. Here is what that looks like across four functions.
1. Marketing Reporting: Channel Performance and Attribution
Marketing needs daily ROAS and spend pacing by channel, CAC by acquisition source, creative performance breakdowns, and retention by acquisition channel. The critical upgrade from basic eCommerce dashboard reporting is moving from platform-reported ROAS (which every ad platform inflates in its own favor) to independent attribution that reconciles what Meta, Google, and Shopify each claim against actual order data. Cohort analysis and LTV reporting at the channel level answers the question basic attribution tools leave open: which channels bring customers who come back?
2. Finance Reporting: Profitability by Channel, SKU, and Cohort
Finance needs the full P&L by channel and SKU, not just topline revenue. That means contribution margin by channel after COGS, fulfillment, returns, and ad spend. Daily and weekly margin views let the CFO catch channels that look profitable on a ROAS basis but are quietly bleeding margin once you account for the cost stack underneath.
This is the reporting gap that ROAS-only tools leave completely open: the ability to answer "which channel drove profitable revenue" rather than just "which channel drove revenue."
3. Operations Reporting: Inventory, Fulfillment, and Demand
Operations needs inventory health by SKU and warehouse, stockout risk by sell-through rate, demand forecasting against current stock, and fulfillment cost tracking across 3PL and FBA. This is the most consistently underpowered reporting function in most eCommerce stacks. It usually lives in a spreadsheet someone updates manually, which means the data is already outdated by the time anyone reads it.
Momentous achieved near-real-time operational visibility by replacing manual reporting with a unified data foundation. Read the full case study →
4. Executive Reporting: The Single-Page View That Drives Decisions
The CEO and board need one view showing GMV, contribution margin, CAC vs. LTV trend, channel profitability, and a variance flag for anything deviating more than 15% from prior period. The executive dashboard should answer "is the business healthy and where is the risk" in under 30 seconds. It should not require the CEO to cross-reference three reports or ask an analyst to reconcile numbers before a board call.
| Function | Core KPIs | Reporting Cadence |
|---|---|---|
| Marketing | ROAS by channel, CAC, blended MER, creative CTR/CPC, email/SMS attribution, new vs. returning split | Daily spend pacing; weekly channel review |
| Finance | Contribution margin by channel/SKU, gross margin %, return rate by product, fulfillment cost per order, revenue reconciliation | Daily CM view; weekly P&L; monthly close |
| Operations | Days of inventory, stockout risk by SKU, 3PL vs. FBA cost, return processing rate, demand forecast accuracy | Real-time fulfillment; weekly inventory |
| Executive | GMV vs. target, CM %, blended CAC, CLV:CAC ratio, channel revenue, prior-period variance, anomaly flags | Weekly summary; monthly board deck |
Understanding the reporting stack is only half the problem. The more important question is whether the stack supports the decisions each team needs to make. Marketing, finance, operations, and leadership do not consume the same KPIs, but they do need to operate from the same underlying definitions. That is where fragmented reporting environments typically fail.
The Best eCommerce Reporting Tools in 2026
Choosing the right eCommerce reporting software depends on which reporting problem you are solving. A Shopify-only DTC brand spending $30K/month on ads has different needs than a $50M omnichannel operation running Shopify, Amazon, wholesale, and a 3PL. This section covers five platforms, organized by what each does best.
Saras iQ: Unified Operating Layer for Omnichannel Brands (revenue > $20M)
Saras iQ is a reporting and analytics platform built specifically for omnichannel eCommerce brands doing over $20 million in revenue. It approaches the reporting problem differently than most tools. Instead of connecting dashboards to siloed data sources, Saras iQ unifies all data into a single certified semantic layer and delivers pre-built reporting for every team from the same foundation.
What separates it from point-solution eCommerce reporting tools:
- Every report pulls from the same certified data model with locked metric definitions. Marketing, finance, and operations are looking at the same version of "revenue," "contribution margin," and "customer." Contribution margin by channel connects ad spend to COGS, fulfillment, and returns, producing the P&L view that ROAS-only tools cannot.
- Pre-built dashboards cover executive summary, marketing analytics, financial view, and operations view.
- Saras Daton provides 200+ eCommerce data connectors, including Amazon Seller Central, 3PL systems, and ERP integrations that lighter tools leave out.
- Saras iQ functions as an AI eCommerce analyst sitting on top of the data layer, answering questions in plain English with every answer traceable to certified data.
"We go to Saras iQ and get our daily contribution margin reporting. We get all of our marketing metrics by channel, by category, even down to the SKU. Everything is pulled in automatically." — Jason Panzer, President, HexClad
Best for: Brands at $20M+ revenue running across multiple channels where the reconciliation problem is real and the CFO's spreadsheet stopped agreeing with the marketing dashboard a long time ago. Pricing: From $300/month for Growth; custom enterprise pricing.
Triple Whale: Best for Shopify DTC Marketing Reporting
Triple Whale is the most widely adopted reporting tool in the Shopify DTC ecosystem, with over 50,000 brands on the platform. Its core strength is marketing attribution reporting, which includes blended ROAS, CAC, and creative performance across Meta, Google, TikTok, and other paid channels, tied to Shopify first-party data through the Triple Pixel.
The Moby AI assistant supports natural language queries for daily eCommerce sales reporting. Triple Whale has expanded into profit tracking, but its depth on finance and operations remains lighter than platforms built around a full data warehouse.
The attribution methodology behind Total Impact is proprietary, which means it is not fully auditable. For brands that need transparent, customizable attribution logic, that is worth weighing. But for the core use case of daily marketing performance monitoring on Shopify, Triple Whale delivers a clean, fast experience.
Best for: Shopify-only DTC brands spending under $50K/month on ads who need reliable marketing attribution and creative reporting without the complexity of an enterprise data platform. Pricing: From $129/month.
Polar Analytics: Best for Cross-Channel ECommerce Analytics
Polar Analytics is an eCommerce intelligence platform designed for brands that have outgrown channel-level reporting and need a unified view across Shopify, Amazon, subscriptions, paid media, and customer retention.
The platform consolidates data from multiple eCommerce systems into pre-built dashboards focused on revenue, cohort performance, attribution, and profitability trends. Where Polar stands out is in cross-channel visibility: instead of optimizing Meta or Google in isolation, teams can analyze how acquisition, retention, and repeat purchase behavior interact across the full customer lifecycle.
The tradeoff is flexibility: highly customized semantic modeling and finance workflows remain more limited than enterprise BI environments.
Best for: Mid-market Shopify and omnichannel brands that need cross-channel eCommerce analytics without building a dedicated internal data team. Pricing: Custom pricing based on business size and integrations.
Looker: Best for Enterprise BI and Semantic Modeling
Looker is Google's enterprise business intelligence platform built for organizations that want complete control over reporting logic, metric definitions, and data modeling. Unlike eCommerce-native reporting tools, Looker is not a packaged analytics product with pre-built dashboards for marketers or operators.
It is a warehouse-native BI environment where teams build their own reporting architecture directly on top of centralized cloud data infrastructure. Its core strength is semantic modeling through LookML, which allows organizations to standardize business definitions across reporting environments and enforce consistent metrics at scale.
For eCommerce brands with dedicated analytics engineering resources, Looker provides decent flexibility. Teams can build highly customized reporting across finance, operations, customer analytics, inventory, and forecasting while maintaining governance over how KPIs are defined.
However, the limitation is complexity. Implementation typically requires technical ownership, ongoing model maintenance, and a mature internal data stack. For many eCommerce operators, the challenge is not visualization but the operational overhead required to maintain the reporting environment itself.
Best for: Enterprise eCommerce brands with internal analytics or data engineering teams that need customizable BI infrastructure and semantic governance across large datasets. Pricing: Custom enterprise pricing.
Databox: Best for KPI Dashboards and Goal Tracking
Databox aggregates data from 70+ integrations into a single dashboard with built-in goal tracking and threshold alerts. You set a target for each KPI, and Databox notifies you through Slack or email when performance deviates.
Where Databox is lighter: no eCommerce profitability reporting, no custom data warehouse support, and the depth of eCommerce-specific KPI reporting is thinner than dedicated platforms. It works best as a complement to deeper tools, not a replacement for them.
Best for: Brands that want automated KPI monitoring and threshold alerts without building a full analytics stack. Strong as a daily pacing layer alongside a deeper reporting foundation. Pricing: From $47/month.
What to Look for When Evaluating ECommerce Reporting Tools
When comparing the best eCommerce reporting tools, run each option through these six questions:
| Criterion | What to Ask | Why It Matters |
|---|---|---|
| Single source of truth | Does every team report from the same underlying data, or does each tool define "revenue" differently? | The fragmentation problem starts here. If metric definitions are not locked, reconciliation never ends. |
| Profitability coverage | Can it report contribution margin by channel, connecting ad spend to COGS and fulfillment? | ROAS-only tools tell you half the story. ECommerce profitability reporting requires the full cost stack. |
| Integration depth | Does it connect to all your actual data sources, including Amazon, 3PL, and ERP? | A tool missing key sources produces reports with systematic gaps. Look for 200+ eCommerce data connectors as a completeness benchmark. |
| Automated delivery | Can reports be scheduled to Slack, email, or Teams? | If someone has to log in and pull the report manually, consistency drops within weeks. |
| Role-specific views | Does marketing get attribution, finance get margin, and the CEO get a summary, all from the same data? | Generic dashboards force each team to build their own workarounds, which recreates the fragmentation problem. |
| AI and natural language | Can the team ask questions in plain English and get answers grounded in certified data? | The best platforms in 2026 go beyond pre-built dashboards, but only when the underlying data is clean enough to trust the answers. |
How to Choose the Right ECommerce Reporting Tool by Stage
| Business Stage | Reporting Complexity | Best-Fit Tools | Best For |
|---|---|---|---|
| Under $1M Revenue | Shopify-native reporting is still sufficient and manual reconciliation remains manageable. | Shopify Analytics, GA4 | Basic eCommerce KPI tracking |
| $1M to $5M Revenue | Marketing attribution is becoming fragmented across Meta, Google, Shopify, and retention channels. | Triple Whale, Supermetrics | Attribution reporting and automated marketing analytics |
| $5M to $20M Revenue | Marketing, finance, and operations use different systems and contribution margin reporting is still partially manual. | Polar Analytics, Looker, Saras iQ | Cross-channel analytics and cross-functional reporting |
| $20M+ Revenue, Omnichannel | ERP, marketplace, fulfillment, finance, and marketing data all need to reconcile from one reporting foundation. | Saras iQ, Looker | Unified reporting architecture and semantic consistency at scale |
Note: Shopify-only brands can typically stay on lighter reporting stacks longer because reporting complexity scales more with operational fragmentation than revenue alone.
Conclusion
The pattern across every stage is the same: reporting breaks when eCommerce reporting tools multiply but the data underneath stays fragmented. Adding another dashboard on top of disconnected systems gives you a better-looking version of the same problem. The brands that report well in 2026 are the ones that invested in the data layer first.
Saras iQ is built for exactly that: a unified reporting foundation that replaces the fragmented stack with one certified source of truth, covering marketing attribution, contribution margin, customer analytics, and operations from the same data model. Talk to the Saras data consultants to see what unified reporting looks like for your channel mix.

.svg)
.webp)
%201%20(1).svg)







.jpg)





%20Statistics%20in%202026.jpg)



%20Software%20for%20DTC%20Brands%20in%202026.png)









%20Setup%20Guide%20for%20Ecommerce%20Finance%20Team.png)



























.webp)

.webp)
.webp)
.webp)
.webp)










.webp)




.webp)