


Your team celebrates the hero SKU. It is the top seller on every report, the product the growth team scales spend around, the SKU that gets priority safety stock so it never goes out of stock. It also might be the single biggest drain on your ecommerce working capital.
A product's cash conversion cycle, not its sales rank, determines whether it generates or drains capital. High velocity often means high return rates, aggressive ad spend to maintain rank, and large purchase orders that lock cash in the warehouse for months. Contribution margin visibility at the SKU level is what turns this from a guessing game into a capital allocation decision. This guide breaks down how bestsellers quietly consume working capital, when to de-prioritize them, and how to audit your catalog for true profitability.
Is your data actually Decision-Grade?
9 questions. 3 minutes. Score your Profitability Visibility and Readiness for AI-driven growth.
Start Free Diagnostic
The Anatomy of a Capital-Draining Bestseller
A bestselling SKU can drain ecommerce working capital through three mechanisms that compound the faster you grow. Each one looks manageable in isolation. Together, they create a capital trap that tightens as volume increases.
High return rates amplify with volume
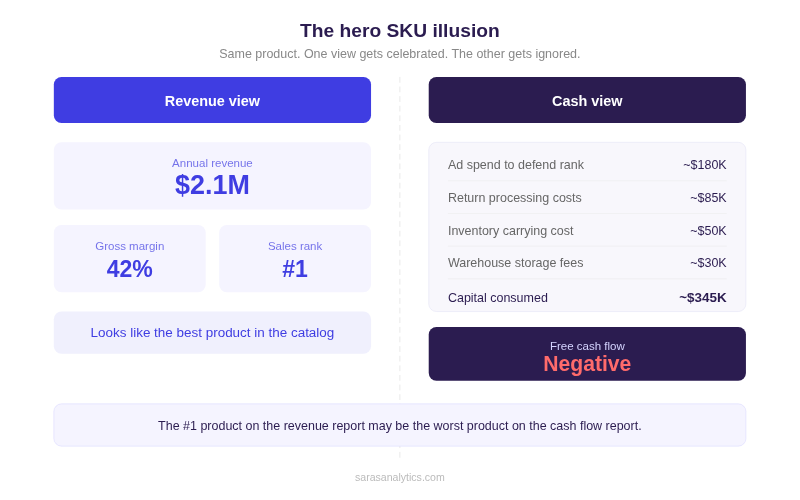
High-selling products generate high returns. On a SKU doing $2M in annual revenue with a 20% return rate, $400K in revenue cycles back through your system as processing costs, tied-up capital, and units that eventually get liquidated at a loss. The refund is the visible part. The capital sitting in transit and restocking limbo for 3-6 weeks per return is the part that quietly compounds.
The ad spend treadmill
The more a SKU sells, the more competitors target it. Maintaining the top seller rank on Amazon or Meta means increasing spend quarter over quarter just to hold position. For example, a DTC supplements brand doing $18M annually might spend $180K/year on Meta for its hero protein powder, watching CAC on that specific SKU rise 12% each quarter while CM2 stays flat. The product still looks like the bestseller on every dashboard. But the ad spend required to keep it there is growing faster than the margin it produces.
Watch for this signal: If CAC on a hero SKU has risen for three consecutive quarters while its CM2 has stayed flat or declined, you are on the treadmill. More than growth, that could be capital being burned to maintain a position that no longer pays for itself.
Inventory bloat from the fear of stockouts
Nobody wants to be the person who let the bestseller go out of stock. So, the planning team over-orders. They carry 14 weeks of safety stock instead of 8. They place larger POs with longer lead times to lock in supplier pricing. The result is capital tied up in inventory that sits in the warehouse for months, accruing storage fees, while higher-margin products with shorter lead times get under-ordered because the budget is already committed.
Why Gross Margin Hides the Real Cost of Your Bestsellers
Gross margin tells you what is left after COGS. It does not tell you what is left after the costs that determine whether a product produces cash or consumes it. For products that destroy margin but look good on revenue, the distance between gross margin and CM2 is where the capital drain hides.
The costs between CM1 and CM2 are where bestsellers break
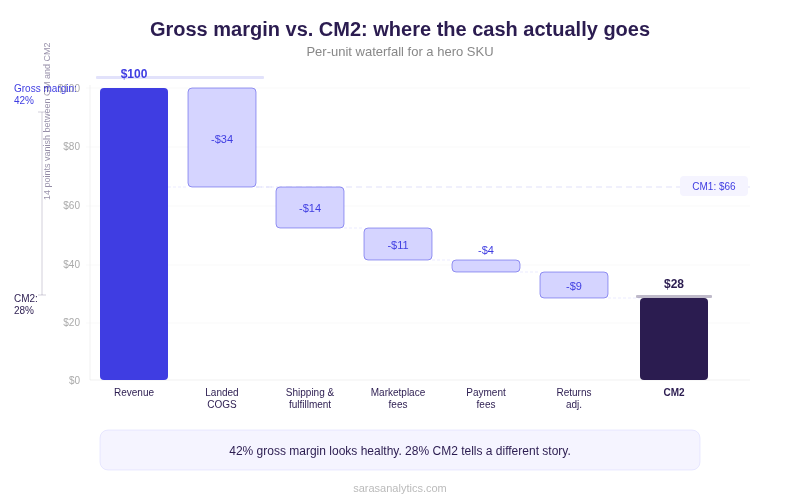
A hero SKU with 42% gross margin has not yet absorbed shipping (varies by weight, destination, carrier), pick-and-pack fees (varies by box size), marketplace fees (Amazon referral fees run 8-15% by category), or payment processing. Here is how those costs layer for a typical hero SKU:
A 42% gross margin can drop to 12-15% at CM2 once these costs land. And if the ad spend to maintain that SKU's velocity pushes CM3 negative, every additional unit sold costs you money. Understanding what is contribution margin is the difference between scaling profitably and scaling into a cash trap.
Important: Landed COGS and factory invoice COGS are not the same number. Factory invoice is the price you paid for the product. Landed COGS includes inbound freight, duties, tariffs, and warehouse receiving costs. The difference can run 15-25% depending on origin country and shipping method. If your CM1 is based on factory invoice, every number downstream is inflated.
How One Hero SKU Starves the Rest of Your Catalog
The capital damage from a bestseller does not stop at that one product. It reshapes what the entire business can and cannot do.
The bestseller is eating your product pipeline
Consider a DTC apparel brand with $1.5M in total ecommerce working capital and $380K locked in one hero SKU's safety stock and receivables. That is 25% of available capital committed to a single product that may not be generating free cash flow. The remaining 75% has to cover every other SKU, new product development, marketing experiments, and operating expenses.
That $380K, redeployed, could fund test launches of three emerging products at $40K each, products that cohort data might show have 2x the CM2 of the bestseller. It could cover a bulk purchase of a fast-turning accessory that cycles inventory in 30 days instead of 90. It could fund the channel experiment that breaks dependence on the ad spend treadmill.
This is portfolio thinking, and it is where the conversation shifts from merchandising to capital allocation. Every dollar locked in a slow-turning, low-CM2 SKU is a dollar unavailable for faster-turning, higher-margin products. The bestseller is not just underperforming. It is actively crowding out better bets.
When the organization bends around one product
The longer a brand over-indexes on a hero SKU, the harder it becomes to diversify. Planning builds the buy plan around it. Marketing builds campaigns around it. Ops optimizes warehouse layout around it. New products get under-invested because the entire organization is structured around one product's velocity, not its profitability.
This is exactly what Greater Than discovered when they unbundled subscription bundles to see true product-level performance. That visibility revealed which SKUs were generating cash and which were quietly consuming it, enabling a rebalanced portfolio that improved inventory management by 30%.
👉 Read the full Greater Than case study
3 Scenarios When to De-Prioritize Your Bestseller
Most insights about SKU profitability stops at "measure your margins better." That is not enough. The hard part is what you do with the data. Here are three situations where the right move is to intentionally pull back on a hero SKU, even though it feels counterintuitive.
1. When CM3 has been negative for two consecutive quarters
If a SKU's contribution margin after marketing spend is negative and has not improved in two quarters despite optimization efforts, you are subsidizing its sales with cash from the rest of the catalog. The decision is not "how do we fix it." The decision is "how quickly can we reallocate that ad budget to SKUs where CM3 is positive."
2. When CCC exceeds your cash conversion capacity
A hero SKU with a 97-day cash conversion cycle in a business that needs capital back in 45 days is borrowing from the rest of the product line. If reducing safety stock from 14 weeks to 8 weeks would free $150K in working capital without a meaningful stockout risk (based on actual sell-through velocity, not fear), that is a decision worth making. Sometimes letting a hero SKU go out of stock for a week costs less than keeping $150K locked in the warehouse for an extra six weeks.
3. When the hero SKU is blocking higher-CM2 products from scaling
If your catalog data shows three products with 2x the CM2 of the bestseller but 50% less inventory investment, and those products are under-ordered because the hero SKU absorbs the purchasing budget, that is a capital misallocation problem. The fix is a rebalance of how to scale or exit product categories based on CM, not based on sales rank.
How to Audit Your Hero SKUs for True Profitability in 5 Steps
Identifying which SKUs drive cash in ecommerce and which drain it requires a structured audit that most brands have never run because their cost data is scattered across disconnected systems.
Step 1: Calculate fully landed COGS
Start with the factory invoice, then add inbound freight, duties, tariffs, inspection costs, and warehouse receiving charges. This is your true CM1 baseline. If you have been using factory-gate pricing, your margins on every downstream calculation are overstated.
Step 2: Allocate marketing spend at the SKU level
Stop relying on blended ROAS across the catalog. If you tag ad set naming conventions with SKU identifiers, you can calculate spend per product. For Amazon, sponsored ad spend by ASIN gives you a direct line. For Meta and Google, this requires naming conventions or a data platform that maps ad spend to SKU-level revenue.
Step 3: Factor in exact fulfillment and return costs per unit
Shipping costs vary by weight, box dimensions, destination zone, and carrier. Return rates vary by category and channel. A 4% return rate on accessories and a 22% return rate on apparel mean radically different CM2 numbers, even if gross margin is identical.
Step 4: Measure the cash conversion cycle (CCC) for each SKU
CCC tells you how many days a dollar spent on inventory takes to come back as cash. A hero SKU with a 97-day CCC locks up three times more working capital than a product cycling in 34 days, even if the hero generates more revenue. Knowing the margin by SKU before purchase decision is important; but knowing how long that margin takes to convert to cash is what drives working capital planning.
What this looks like in practice: a brand runs this audit and discovers their #1 revenue SKU has a 97-day CCC while their #8 SKU, a lower-revenue accessory with higher margin, cycles in 34 days. Per dollar of capital deployed, the #8 SKU generates more free cash flow. The rebalancing decision becomes obvious once the numbers are visible.
"Every single day I'm going in there, looking at my contribution margin. I'm looking at my sales breakdown, my sales by product type." — Sean Frank, CEO, Ridge
Step 5: Benchmark against your catalog to find outliers
Once you have CM2 and CCC by SKU, rank the catalog. Products in the top quartile of revenue but bottom quartile of CM2 or top quartile of CCC are your capital traps. A thorough contribution margin analysis at this level leads directly to action: reduce safety stock, reallocate ad spend, renegotiate supplier terms, or exit the product entirely.
BPN identified exactly these kinds of capital traps through SKU-level analysis, exposing $500K in annual inventory write-off savings by redirecting purchasing away from SKUs that consumed capital without producing returns.
👉 Read the full BPN case study
Unlocking Working Capital with Saras Pulse
Most teams never run this audit mainly because reconciling Shopify, Amazon, 3PL, ERP, and ad platform data at the SKU level is operationally impossible in spreadsheets. That gap between "knowing you should measure this" and "actually having the numbers" is where capital quietly bleeds.
Saras Pulse closes that gap with SKU-level profitability reporting at CM1, CM2, and CM3 updated daily, mapping ad spend to individual products and giving finance and ops the same contribution margin intelligence platform so inventory decisions are backed by unit economics, not gross margin assumptions.
Conclusion: Revenue Is Vanity. Cash Is the Constraint.
The bestseller looks great on every report that stops at gross margin. But when you push past gross margin to CM2, then layer in the cash conversion cycle, then the picture changes. Some hero SKUs remain heroes. Others turn out to be the most expensive products in the catalog, consuming capital that could fund faster-turning, higher-margin alternatives.
Saras Analytics builds the visibility layer that makes this distinction possible. Talk to our data consultants about what an inventory profitability analysis by SKU would reveal for your brand.

.png)
.svg)
%201%20(1).svg)


.png)


.png)


.png)


.png)


.png)


.png)


.webp)


.avif)


.avif)

.avif)
.avif)
.avif)
.avif)
%20(1).avif)
.avif)
%20(1).avif)
%20(1).avif)


.avif)


