


A brand CEO recently connected Claude directly to his BigQuery warehouse and asked a straightforward profitability question. The AI returned a number with full confidence. It was wrong. The model had pulled from an unmapped table, blended paid and organic channels, and used gross revenue instead of net. Nobody caught it until the CFO compared the answer to his own spreadsheet, which told a different story for different reasons.
That gap between what AI promises and what messy data delivers is where most eCommerce AI initiatives stall. AI ready data starts with whether the data underneath can support a correct answer, regardless of how good the model is or how skilled the prompt engineer.
The brands pulling real value from AI are the ones that invested in their data foundation before they invested in intelligence. Everything else, the models, the agents, the automated workflows, compounds on that foundation or collapses without it. This article breaks down the symptoms of being stuck in spreadsheets, why AI fails on bad data even when the model is excellent, what an AI-ready architecture actually requires, and how to build one without a 20-person data engineering team.
Is your data actually Decision-Grade?
9 questions. 3 minutes. Score your Profitability Visibility and Readiness for AI-driven growth.
Start Free Diagnostic
The Symptoms of Being Stuck in Spreadsheets
Most eCommerce brands have plenty of data. What they lack is a single version of it that everyone trusts. The symptoms show up long before anyone tries to implement AI, and they tend to get normalized until a new hire or a board member asks why the numbers do not match.
The Data Janitor Problem
Analysts and planners at growing DTC brands routinely spend 60-80% of their week downloading CSVs, cleaning columns, and matching IDs across platforms.
A senior director of planning at one apparel brand described spending "20% of the week just pulling data from Netsuite, pulling data from Shopify, putting them together, making sure it's right, validating it." That is a fifth of a senior operator's time consumed before any analysis begins. When financial data consistency across teams depends on one person's Excel skills, the business has a single point of failure disguised as a process.
The Version Control Nightmare
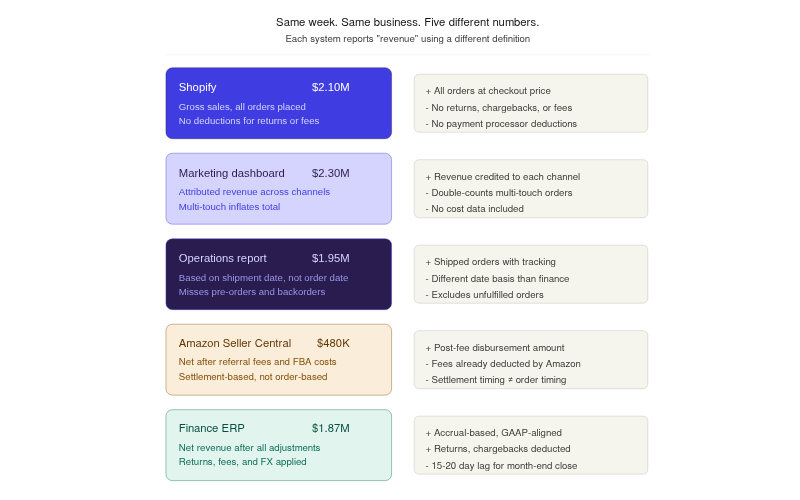
Consider a DTC skincare brand doing $55M across Shopify, Amazon, and TikTok. Marketing reports $2.1M in weekly revenue because they pull from Shopify's gross sales. Finance reports $1.87M because they account for returns, chargebacks, and payment processing fees. Operations reports $1.95M because they use a different date range based on shipment date rather than order date. Three teams, three spreadsheets, three versions of revenue. The Monday leadership meeting turns into a 30-minute reconciliation exercise instead of a strategy discussion. Reconciling financial data across systems becomes the actual job, not a step toward the job.
High Latency Decisions
Manual reporting cycles create a structural lag between when events happen and when operators have data to evaluate them. A CFO at a $50M coffee brand described it plainly: "50-60% of companies won't make any decisions in December about December's numbers until January."
For an outdoor gear brand with seven-month manufacturing lead times, this lag is catastrophic. By the time they notice a product is underperforming, the next production run is already committed.
The Definitions Gap
This symptom is the least visible and the most damaging. Different teams use the same words to mean different things. "Revenue" to a marketer is demand revenue, the total value of orders generated. "Revenue" to a finance team is net revenue, after returns, cancellations, and adjustments. "Churn" might mean cancelled subscriptions to one team and 90-day purchase inactivity to another.
When every team defines core metrics differently, the spreadsheets are not wrong; they are each correct by their own definitions. The problem is no one agrees on the definitions. This is why finance, ops, and marketing have different numbers, even when they are all looking at the same time period.
The Silent Breakage Problem
Spreadsheets do not send alerts when a formula breaks. A VLOOKUP that stops matching after a SKU name changes in the source system does not throw an error; it returns a zero or a blank. A tab that someone forgot to refresh last Tuesday quietly serves stale data for the rest of the month. Unlike a managed data pipeline, spreadsheets degrade silently. By the time someone notices, decisions have already been made on bad numbers.
Why Great AI Fails on Bad Data
AI models are pattern-matching engines. They learn from the structure and relationships in historical data. If that data is messy, incomplete, or inconsistently defined, the AI learns the wrong patterns with the same confidence it would learn the right ones. MIT's Project NANDA research found that 95% of organizations deploying generative AI saw zero measurable return, and the failure almost never traces back to the model itself.
Garbage In, Confidence Out
The classic "garbage in, garbage out" framing understates the problem. A spreadsheet with bad data at least looks like a spreadsheet. You can eyeball it, spot a weird number, trace it back. AI does not work that way. When a language model queries a messy warehouse and assembles an answer, it presents that answer as fact. There is no asterisk, no confidence interval, no "I'm not sure about this."
A CFO at a fast-growing DTC brand described the experience after connecting an LLM to his warehouse: the AI sometimes hallucinates and gives wrong answers, and then his team has to prompt it again, but only if they already know what the right answer should be.
Watch for this signal: If your team has to already know the answer to validate whether the AI's answer is correct, the AI is not saving time. It is adding a step.
The Context Gap
AI needs the full picture to optimize for the right outcome. If your marketing data (CAC, channel spend, attributed revenue) lives in one system and your fulfillment data (COGS, shipping costs, return rates) lives in another, the AI cannot calculate true profitability. It will optimize for the metric it can see, usually revenue or ROAS, while ignoring the costs that determine whether that revenue is profitable.
This is the difference between an AI that tells you "this campaign is performing well" and one that tells you "this campaign generates revenue at a 3% contribution margin after fulfillment costs, which is below your 15% threshold."
The Build-It-Yourself Trap
With tools like Claude, ChatGPT, and open-source LLMs now widely accessible, a growing number of DTC operators are asking a reasonable question: why not just connect the model to our warehouse and skip the middleman?
The logic makes sense on the surface. The model is available. BigQuery or Snowflake already holds the data. An MCP server or API connection takes an afternoon to set up. But the gap between "connected" and "accurate" is enormous.
Here is what breaks down in practice:
- No definitions layer. When you ask the AI "what's our CAC by channel?" it has to decide which table holds CAC data, whether to use gross or net revenue, and how to attribute multi-touch conversions. Without a definitions layer, it guesses. Different questions on different days may produce different answers from the same data.
- No one to maintain it. A CEO who builds an AI workflow over a weekend still needs someone to fix it when a schema changes, a new data source is added, or the model starts returning stale results. Building is a weekend project. Maintaining is a full-time job. As one founder described after building an internal operating system: "I can build it, but I can't hand it off. Nobody else will go deep enough to fix it when it breaks."
- Production brittleness. An agent that auto-generates purchase orders or pauses underperforming campaigns is useful until it fails during Black Friday. The CEO cannot stop running the business to debug an AI workflow during the highest-revenue week of the year.
- Hallucination without guardrails. Connecting an LLM to a raw warehouse means the model scans every available table and uses a best-guess approach to find relevant data. If you say "revenue," the model does not know whether you mean demand revenue, net revenue, or gross revenue. It picks one and does not tell you which.
Gartner predicts that through 2026, organizations will abandon 60% of AI projects that lack AI ready data. The data was never prepared for the questions being asked, and the model has no way to compensate for that.
What Does an AI-Ready Data Foundation Actually Look Like?
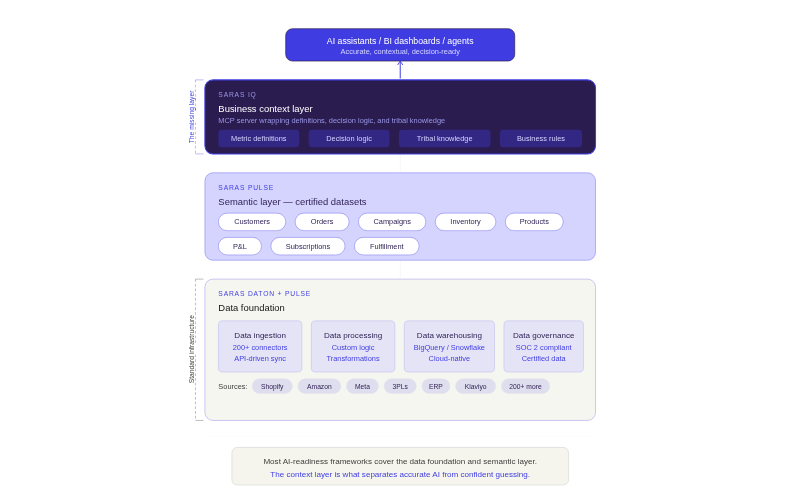
An AI-ready data foundation is the architecture that makes it possible for AI models, BI tools, and operational workflows to query business data and get consistently accurate answers. It requires three structural components and one layer that most frameworks skip entirely.
Centralization: A Single Source of Truth for Financial Data
The first requirement is moving data out of native platform dashboards and disconnected spreadsheets into a central cloud data warehouse like Google BigQuery or Snowflake. Every team can still use Shopify or Amazon dashboards for day-to-day operations; the warehouse is where all the data meets, gets cleaned, and becomes query-ready.
According to HBR Analytic Services research, 91% of organizations agree a reliable data foundation is essential for AI adoption, but only 55% say their own foundation meets that standard.
Automated Extraction (ETL/ELT)
Manual CSV downloads are the first thing that has to go. Automated pipelines sync data from source platforms (Shopify, Amazon, Meta, 3PLs, ERPs) into the warehouse on a scheduled cadence, hourly or daily, without human intervention. This eliminates the "data janitor" problem and ensures that reports run on current data, not last Tuesday's export. Saras Daton, for example, connects to over 200 platforms and replicates data into the warehouse automatically, including historical backfills and intraday syncs.
Standardized Schemas and Data Models
Raw data from different platforms uses different naming conventions, ID structures, and product hierarchies. A SKU in Shopify may not match the same SKU in Amazon or Netsuite. Standardizing this into a unified schema, mapping all variant IDs to a master product hierarchy, normalizing currency and timezone differences, and applying consistent business logic, is what makes the data usable for cross-platform analysis. Without it, any query that spans two or more sources risks joining on the wrong keys or double-counting transactions.
The Business Context Layer (What Most Frameworks Miss)
Important: Centralization, automation, and standardization get your data into one place. The business context layer is what makes AI answers accurate instead of generic.
A context layer encodes how your specific business defines and measures performance. It includes metric definitions (what "net revenue" means, what costs are included in CM2), decision logic (when a campaign ROAS of 7x is actually underperforming because your breakeven is 12x), and business rules (which supplier to prioritize for rush orders, how to handle pre-order revenue recognition).
Without this layer, an AI model treats your warehouse like any other database. With it, the AI answers questions the way your most experienced operator would. This is the difference between "Claude for general questions" and "Claude that understands your business." Saras Analytics is building this layer into its IQ product, wrapping business definitions into an MCP server that LLMs can call, so queries return answers grounded in your company's measurement framework rather than the model's best guess.
Four Steps to Escape Spreadsheet Hell and Build AI Ready Data
Moving from spreadsheets to an AI-ready foundation does not require a two-year infrastructure project. The most effective approach is phased: start with the basics, prove value quickly, and layer sophistication as the foundation matures.
Step 1: Audit Your Data Silos
Map every platform where critical business data currently lives and who owns it. For a typical DTC brand doing $30-60M, this list usually includes Shopify (or multiple Shopify stores), Amazon Seller Central, a 3PL (Stord, ShipBob, or similar), an ERP (Netsuite, Brightpearl), ad platforms (Meta, Google, TikTok), an email/SMS platform (Klaviyo), and 2-5 additional tools. The audit should also capture which teams pull from which systems and whether they use the same definitions for shared metrics. This step typically reveals that 3-5 key business metrics have competing definitions across the organization.
Step 2: Automate the Ingestion
Replace manual CSV downloads with API-driven pipelines that sync data into a cloud warehouse on a regular cadence. This is where tools like Saras Daton and similar ETL platforms eliminate the data janitor problem. The goal is zero human involvement in getting raw data from source systems into the warehouse.
What this looks like in practice: Your 3PL shipping data, which previously arrived as a 33GB file at month-end that no one could open in Excel, now flows into BigQuery daily. Your ad platform spend data, which a team member used to screenshot from the Meta dashboard every Monday, syncs automatically every morning.
💡 Unify Your Data: True Classic unified 40+ disconnected tools into a single data ecosystem using this approach, saving over 1,000 hours annually.
👉 Read the True Classic case study
Step 3: Build the Analytics Layer
With raw data in the warehouse, the next step is transforming it into query-ready models. This means mapping product hierarchies across platforms, joining revenue data with cost data, applying business logic for metric calculation, and building the certified datasets that teams will use. This is the stage where data integrity in finance reporting gets established: consistent definitions from gross margin through contribution margin, standardized attribution rules, and unified customer identity across channels.
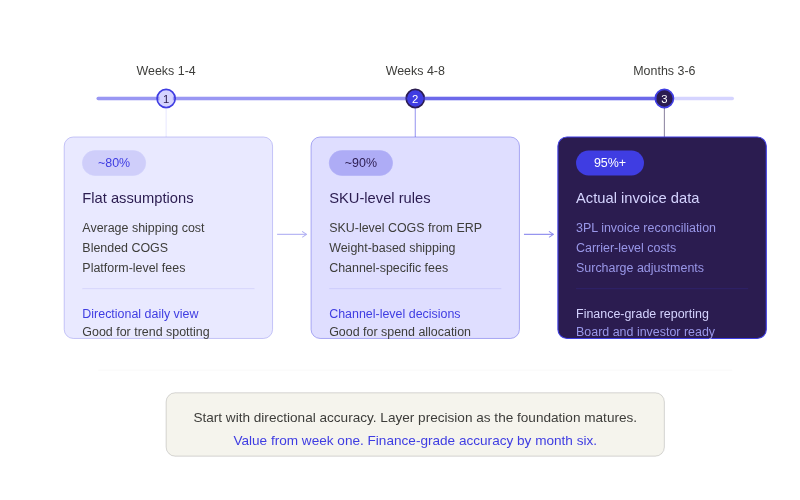
The accuracy does not have to be perfect from the start. A phased milestone approach works well: flat assumptions in phase one (average shipping cost, blended COGS) get you to roughly 80% accuracy within weeks, good enough for a directional daily view. SKU-level COGS and weight-based shipping rules in phase two push accuracy to about 90%. Actual 3PL invoice data and carrier-level costs in phase three reach 95%+ accuracy over a few months. The key is getting value from day one rather than waiting six months for perfection.
Step 4: Deploy Intelligence on the Clean Foundation
With certified data in place, you can connect BI dashboards, AI assistants, and automated workflows that work. This is where the compounding happens. Every agent, every alert, every model built on a clean foundation produces accurate outputs from day one. Every agent built on a messy foundation requires ongoing babysitting and manual verification, which defeats the purpose.
💡 Real-Time Cohort Data: Momentous used this phased approach to build an AI-ready data foundation that delivers near-real-time insights across teams. Beyond faster dashboards, the foundation gave them the ability to monitor the impact of retention initiatives through cohort analysis in real time, rather than weeks after campaigns ended.
👉 Read the Momentous case study
Future-Proof Your Brand with Saras Analytics
Saras Analytics provides the infrastructure that makes eCommerce data AI ready without requiring brands to build or maintain a data engineering team.
- Saras Daton handles automated ingestion from 200+ connectors, replacing manual exports with scheduled, reliable pipelines that cover long-tail sources like 3PLs and ERPs.
- Saras Pulse builds the analytics layer: certified datasets, unified product masters, standardized metric definitions, and pre-built dashboards for contribution margin, customer cohorts, inventory, and marketing performance. Ben Yahalom, CEO of True Classic, described the shift: "Before Saras, our P&L was built on estimates and pieced together from various tools. Saras integrated our ERP in record time, consolidated financials from all channels, and eliminated unnecessary third-party tools."
- Saras IQ adds the business context layer on top of certified data, wrapping metric definitions into an MCP server so AI answers reflect how your business measures performance. Lauren Festante, SVP Finance at Momentous: "Saras helped strengthen this foundation by improving the consistency and visibility of our product and margin data."
Together, the three layers give brands a path from spreadsheet-dependent reporting to AI-ready operations, managed as a service.
Conclusion
Every eCommerce brand will use AI within the next two years. The question is whether that AI will operate on certified, governed, contextually rich data, or on the same disconnected spreadsheets that already cause problems today. The brands that invest in their data foundation now will compound every AI initiative on top of it. The brands that skip the foundation will keep debugging wrong answers and wondering why their AI projects stall.
Stop letting messy data hold back your growth. Get the omnichannel data intelligence platform that centralizes your data and makes your business truly AI ready. Talk to our data consultants about building your AI-ready foundation.

.png)
.svg)
%201%20(1).svg)


.png)


.png)


.png)


.png)


.png)


.png)


.webp)


.avif)


.avif)

.avif)
.avif)
.avif)
.avif)
%20(1).avif)
.avif)
%20(1).avif)
%20(1).avif)


