


There is a specific week in every scaling brand's life when the CFO pulls the growth lead into a room and asks a version of this question: "We hit every CAC target last quarter. So where did the cash go?"
The answer is almost never one bad campaign or a rogue agency. It is the eCommerce CAC calculation itself. The formula most brands use bakes in blind spots: organic customers inflating efficiency, gross margin standing in for real profit, and lifetime value projections that say nothing about when the money comes back.
Knowing where each acquisition dollar lands, and what margin it produces, is what separates brands that scale profitably from those that scale into a cash flow wall. This blog breaks down where standard CAC thresholds fall apart and how to rebuild them against contribution margin that holds up.
Is your data actually Decision-Grade?
9 questions. 3 minutes. Score your Profitability Visibility and Readiness for AI-driven growth.
Start Free Diagnostic
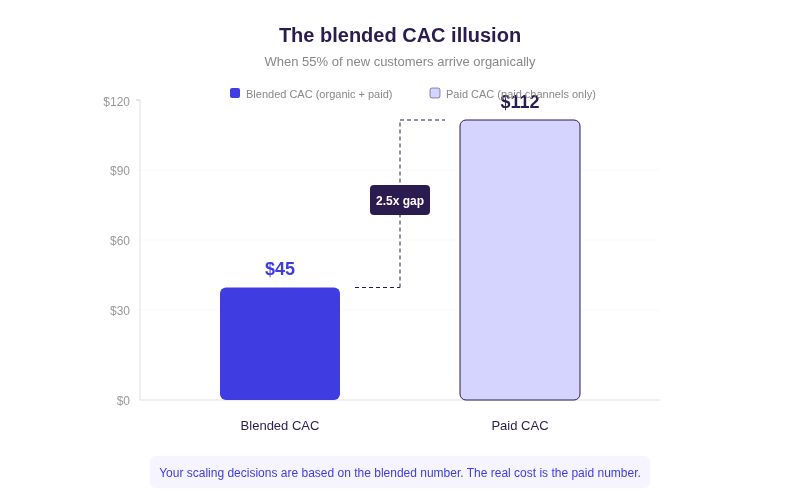
Blended CAC vs. Paid CAC: The Most Dangerous Illusion in eCommerce CAC Calculation
Blended CAC makes paid acquisition look cheaper than it is. Always. Because free customers, organic, direct, referral, email, get averaged in with customers who cost real money. The output is a number that flatters every paid channel in your portfolio.
How blended math hides paid channel costs
Let’s say a DTC skincare brand spends $180K/month across Meta and Google. In March, a product goes mildly viral on TikTok organically. New customers jump 40%, blended CAC drops from $52 to $37, and the growth team greenlights an extra $45K in April spend. April's organic normalizes. That additional budget acquired customers at a paid CAC above $130, but blended only ticked up to $61. The overspend hid for weeks. By the time finance caught the cash flow gap, $45K was already gone.
Nobody changed the ad account. The paid campaigns performed the same way in March and April. What changed was the organic cushion, and the blended number absorbed it silently.
Why organic traffic swings amplify the illusion
This pattern repeats seasonally. A press mention, a holiday search bump, or a social moment pulls blended CAC down for a few weeks. The growth team reads it as paid efficiency improving. However, it is not. The next month, organic returns to baseline and blended CAC spikes, triggering panic budget cuts on campaigns that were performing identically the whole time.
The fix is unglamorous: always report blended and paid CAC separately. Make scaling decisions on the paid number. Blended CAC belongs in board decks. Paid CAC is the number that determines whether your next dollar of spend comes back.
The Problem with "Average" Customer Acquisition Cost
Separating blended from paid is step one. Step two is recognizing that a single average paid CAC across all channels and products is still lying to you.
Channel-mix distortion: cheap channels subsidize expensive ones
Google branded search brings customers in at $22. TikTok prospecting costs $95. Average them and you get $58, which is the real cost of neither. Branded search is almost certainly volume-capped. When budget increases, the incremental dollars flow to TikTok, but the average barely moves because branded search keeps pulling it down. You think you are scaling at $62. The marginal customer acquisition cost is $95.
Marginal CAC: why the next customer always costs more
The next $100K in spend almost always costs more per customer than the last $100K did. Push past high-intent audiences into broader targeting and conversion rates drop, CPMs rise, and the cost curve steepens. Average calculations systematically mask this curve by weighting cheap early customers equally with expensive later ones.
At $5M in annual ad spend, a 10% CAC miscalculation is a rounding error. At $20M, that same 10% is $2M going to channels where every new customer arrives below the profitability line. The average keeps looking fine while the marginal economics get worse.
Watch for this signal: The tell that a channel is hitting saturation is not rising CAC alone. It is rising CAC with flat or declining average order value. If marginal CAC on a channel jumps 15%+ month-over-month and AOV does not move with it, you are buying worse customers at higher prices. That is the trigger to tighten your threshold on that channel, not the quarterly budget review.
Forgetting the "Fully-Burdened" Contribution Margin Sets Your CAC Threshold Too High
If you are using gross margin to set your CAC threshold, you are overspending on every customer you acquire. Gross margin only subtracts COGS. It ignores fulfillment, shipping surcharges, return processing, and payment fees, all of which hit every order before a dollar reaches the bottom line.
The gap between gross margin and CM2
Here is what this looks like in practice. A product carries $80 in gross margin. The growth team sets allowable CAC at $60, leaving what looks like $20 of headroom. But gross margin has not accounted for shipping, pick-and-pack, marketplace fees, or payment processing. Once those variable costs come out, CM2 drops to around $52. That $52 is the actual profit available before any marketing spend. The real CAC threshold just fell from $60 to roughly $35, and nobody saw it because the reporting stopped at gross margin.
The framework that connects CAC to the right profit layer:
A brand spending $15M/year on acquisition with a 30% gap between gross margin and CM2 has roughly $4.5M in spend that looks profitable on the marketing dashboard but pushes CM3 negative at the order level. That is not a rounding error. That is a structural leak that compounds every month it goes undetected.
"Before Saras, our P&L was built on estimates and pieced together from various tools. Saras integrated our ERP in record time, consolidated financials from all channels." — Ben Yahalom, CEO, True Classic
👉 Read the True Classic Case Study
Why day-one margin is never your real margin
Important: Carrier surcharges from FedEx and UPS arrive 2-4 weeks after delivery as end-of-month invoice adjustments. The contribution margin you see on day one is based on estimated shipping. The real number does not finalize until those invoices land. Any CAC threshold built on day-one margin is too high by definition. One of our clients described receiving a 33GB shipping data file for November that could not even be opened in Excel. So, if your finance team cannot reconcile actual shipping costs at the order level, your CAC threshold is built on a guess.

The Payback Period: The Silent Cash Flow Killer
A customer with $400 in lifetime value sounds great at $80 CAC. But LTV says nothing about when that value shows up as cash. If it takes 14 months to recover the $80 and the business needs that capital back in 60 days, you run out of money before the customer ever becomes profitable. LTV is a promise. Payback period is what your bank account actually experiences.
Why LTV without timing is misleading
The payback trap bites hardest when brands are trying to scale. More spend means more cash out the door today, funding customers whose return stretches across quarters. Working capital gets locked into acquisition that technically "works" on a lifetime spreadsheet but starves the business of operating cash right now.
Setting your CAC threshold against a 60-day payback target instead of a 3:1 LTV to CAC ratio changes the question from "can we afford this customer eventually" to "can we afford this customer with the cash we have today." For a brand spending $500K/month on acquisition, that is the difference between scaling and running out of runway.
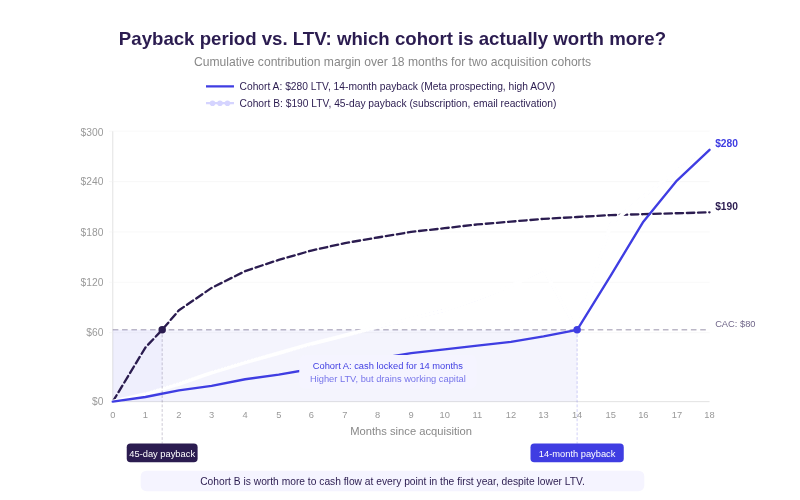
Subscription vs. OTP payback: two different economics
Consider two cohorts from the same quarter. Cohort A comes through Meta prospecting, buys a high-AOV product, and projects $280 LTV. Repurchase is slow. Payback takes 14 months. Cohort B comes through email reactivation, buys a subscription product at lower AOV, and projects $190 LTV. Payback is 45 days because the subscription rebills monthly.
Cohort B is worth more to cash flow at every point in the first year, despite the lower lifetime number. But most brands blend these into a single LTV, set one CAC threshold, and miss that their OTP cohorts take three to four times longer to pay back.
This is exactly where cohort-level payback analysis moves from theory to practice. One of our clients, BPN, used it to identify recently churned high-value subscribers and reactivated them with targeted flows, generating roughly $900K in incremental revenue. The return only became visible because payback and cohort profitability were tracked separately, not blended into a single LTV number.
👉 Read the full BPN case study
How to Calculate Your True CAC Thresholds for eCommerce
Rebuilding a CAC threshold means separating what most brands lump together and recalculating at the level where decisions actually get made.
1. Separate by channel first
Each channel has its own cost structure, audience quality, and conversion behavior. Google branded, Google non-brand, Meta prospecting, Meta retargeting, TikTok, affiliate, and email should each carry distinct thresholds. A channel at $90 CAC might be profitable for a high-AOV category and disastrous for a low-margin one.
What this looks like in practice: pull the last 90 days of spend per channel, match it to new customers each channel actually generated, and calculate paid CAC. Then compare against the CM2 of the product mix that channel tends to sell. If TikTok mostly drives $35 accessories (CM2: $11) while Google non-brand drives your $120 hero product (CM2: $48), their allowable thresholds should be worlds apart.
2. Segment by SKU and product category
A flat CAC threshold across the catalog assumes every product carries the same margin. Once you can see how to improve contribution margin at the SKU level, you stop spending equally to acquire a customer for a $120 product with $48 CM2 and a $35 product with $11 CM2. The first supports a $35 threshold. The second cannot support anything above $8 without losing money on the order.
"We go to Saras Pulse and get our daily contribution margin reporting. We get all of our marketing metrics by channel, by category, even down to the SKU. Everything is pulled in automatically." — Jason Panzer, President, HexClad
3. Adjust for refund and return rates
If the apparel line runs 22% returns while accessories sit at 4%, their effective CM2 is dramatically different. Building return rates into threshold calculations prevents overspending to acquire customers in categories where a quarter of the revenue comes back as refunds.
4. Incorporate payback period by cohort
For each channel-SKU combination, calculate how many days the average customer takes to return the acquisition cost through cumulative margin. Set a payback ceiling, 30, 60, or 90 days, and use it as a hard constraint. A channel delivering $300 LTV over 18 months but requiring 10 months to pay back CAC might not survive your cash flow reality, no matter how good the lifetime number looks.
The same principle applies at the channel level. Faherty, a leading apparel brand in the US, used advanced cohort analysis with CLTV segmentation to identify which acquisition paths produced the fastest and highest returns, not just the highest lifetime value. That precision drove $1.1M in incremental revenue by shifting spend toward paths where payback aligned with cash flow reality.
👉 Read the full Faherty case study
5. Recalculate monthly, not quarterly
CAC thresholds are not set-and-forget numbers. Shipping rates change. Return patterns shift seasonally. Audience saturation moves. Monthly recalculation catches these shifts before they compound. Quarterly recalculation means 8-12 weeks of misallocated spend before anyone notices.
Fixing the CAC Disconnect with Saras Pulse
If you cannot tie ad spend to SKU-level profitability daily, everything above stays theory. Saras Pulse exists because most teams cannot do this without duct-taping five systems together, and by the time finance catches the gap, the money is already gone.
Pulse automates the connection between ad platforms, Shopify, ERP, and 3PL data to produce fully-burdened dynamic CAC thresholds at the SKU and channel level each morning, tracks cohort payback as it develops, and gives the CMO and CFO the same contribution margin intelligence platform so no one is working off different numbers.
Conclusion
The CAC problem is more like a visibility problem. Separating channels, tying thresholds to CM2, tracking payback by cohort: none of this is conceptually hard. What is hard is getting the data to line up across five platforms, daily, at the SKU level, without a finance team spending half the week reconciling spreadsheets. The brands that solve the visibility problem stop guessing their thresholds and start knowing them. The ones that do not keep hitting their targets and wondering where the cash went. Saras Analytics builds that visibility layer. Talk to our data consultants about what it would look like for your brand.

.png)
.svg)
%201%20(1).svg)


.png)


.png)


.png)


.png)


.png)


.png)


.webp)


.avif)


.avif)

.avif)
.avif)
.avif)
.avif)
%20(1).avif)
.avif)
%20(1).avif)
%20(1).avif)


.avif)


