


Running a Shopify store means keeping a constant eye on how your business is performing, from what is selling to where your traffic is coming from. That’s where Shopify analytics comes in, helping store owners make sense of their numbers and spot opportunities.
The Shopify Analytics Dashboard is Shopify's default reporting tool, providing merchants with essential insights from traffic to conversions and inventory flow. While it’s built to be beginner-friendly and visually clear, many eCommerce teams still struggle with one thing: transforming raw numbers into strategic action. Often, the default dashboard is limited to surface-level metrics that don't capture the full picture, especially for brands growing across multiple channels or product lines.
In this blog, we’ll talk about what the Shopify analytics dashboard offers, its key features, where it falls short, and how platforms like Saras Analytics can bridge the gap for brands that want unified, deep, and decision-ready insights.
Is your data actually Decision-Grade?
9 questions. 3 minutes. Score your Profitability Visibility and Readiness for AI-driven growth.
Start Free Diagnostic
What is Shopify Analytics Dashboard?
The Shopify Analytics Dashboard is a built-in tool designed to track and analyze the performance of a Shopify store. It offers reports and insights into essential metrics such as sales, customer behavior, and product performance.
The more consistently you measure your performance, the better your chances of hitting targets and accelerating growth. According to research, businesses that set and track their goals hit some of their goals 96% of the time, and 41% hit all their goals nearly twice as effectively as businesses that don’t track progress regularly.
But what kind of visibility does Shopify’s dashboard really provide? Let’s explore.
Related Read: Shopify LTV
Benefits of Shopify Analytics Dashboard
For new and growing Shopify merchants, the built-in analytics dashboard comes with several advantages:
Instant visibility into sales and product performance
The dashboard provides an at-a-glance view of sales, top products, and performance trends, helping store owners understand how their business is performing in real time. A merchant selling candles, for instance, can immediately see which scents or bundles are outperforming others.
Basic customer insights
Shopify offers basic reports on customer behavior, such as distinguishing between new and repeat buyers, which is valuable for understanding customer loyalty.
Easy-to-use dashboards
With an intuitive interface, the Shopify analytics dashboard is beginner-friendly, making it ideal for store owners who are just starting out.
Included in all Shopify plans
The dashboard is included in all Shopify plans from the basic plan ($39/m) upwards (except for the starter plan), providing access to essential metrics without additional costs.
Live view for real-time monitoring
Store owners can track live activity on their store, including real-time orders and traffic, ensuring they can react swiftly to changes or issues.
How to Access Your Shopify Analytics Dashboard
Getting to your Shopify dashboard is easy, but many users overlook the variety of reports and filters available within it. Here’s how to find your data:
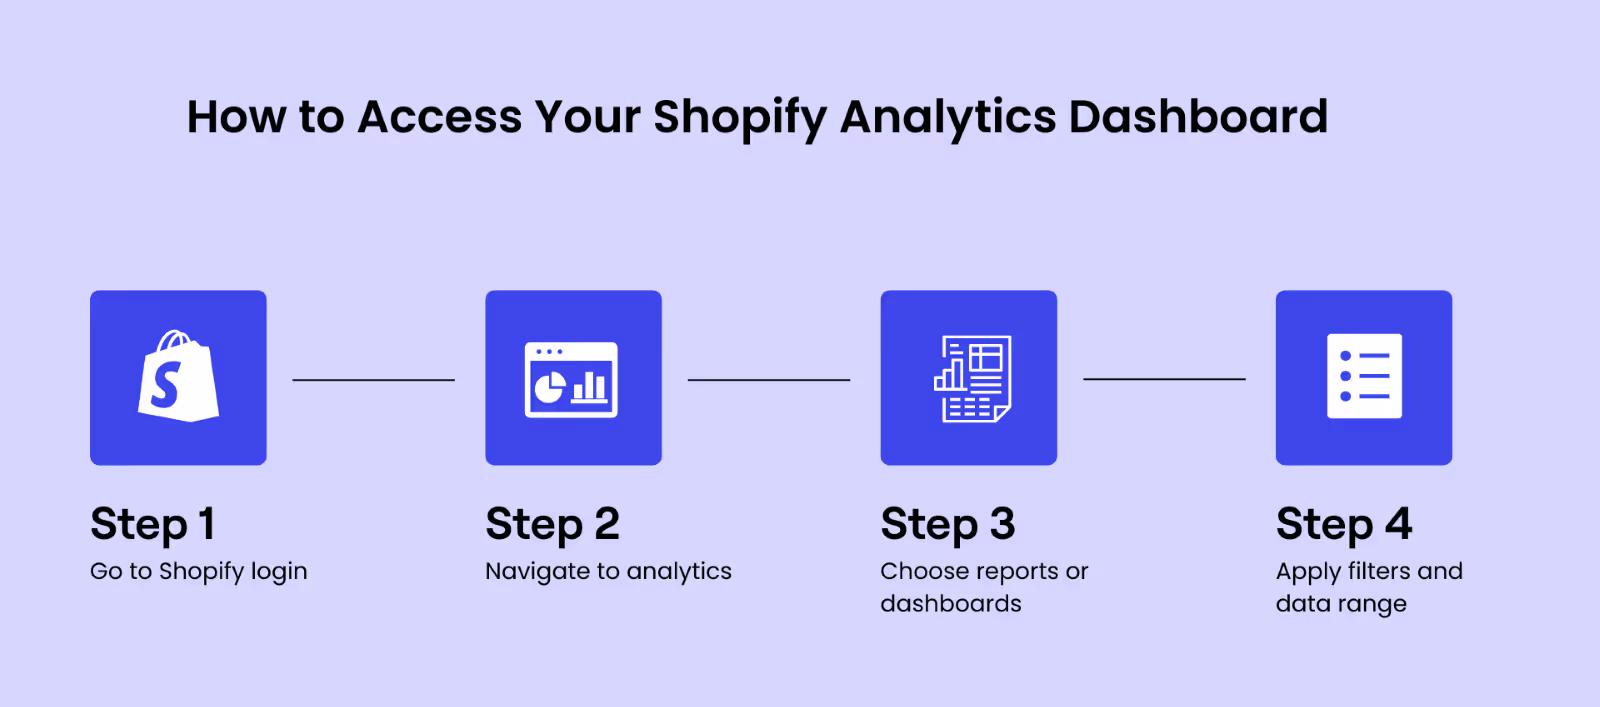
- Log in to your Shopify Admin Panel, Go to Shopify Login and enter your credentials.
- Navigate to the "Analytics" Section On the left-hand menu of your admin panel, click on "Analytics" to access the main dashboard.
- Choose the Report or Dashboard You Want to View
You can select from various reports, such as:
a. Overview Dashboard for a snapshot of store performance.
b. Reports like Sales, Customer, and Marketing.
c. Live View to monitor real-time data. - Use Filters & Date Ranges
The dashboard allows users to filter data by date ranges, products, and traffic channels. This functionality may differ depending on the Shopify plan you’re subscribed to.
For example, Advanced plan users can access custom reports and deep filters, while Basic plan users are limited to standard filters.
By following these steps, you can quickly access your Shopify Analytics Dashboard and start tracking key metrics.
Key Reports Provided by Shopify Analytics Dashboard
Shopify offers a wide range of report categories though the depth of data increases with higher-tier plans.
Here’s a summary of what’s available:
Why This Isn’t Enough for Growing Brands
As your business scales, these native reports can begin to feel rigid. You might want to:
- View Shopify data alongside ad performance from Google or Facebook
- Break down sales by campaign and customer cohort
- Build a dynamic retention dashboard across multiple stores
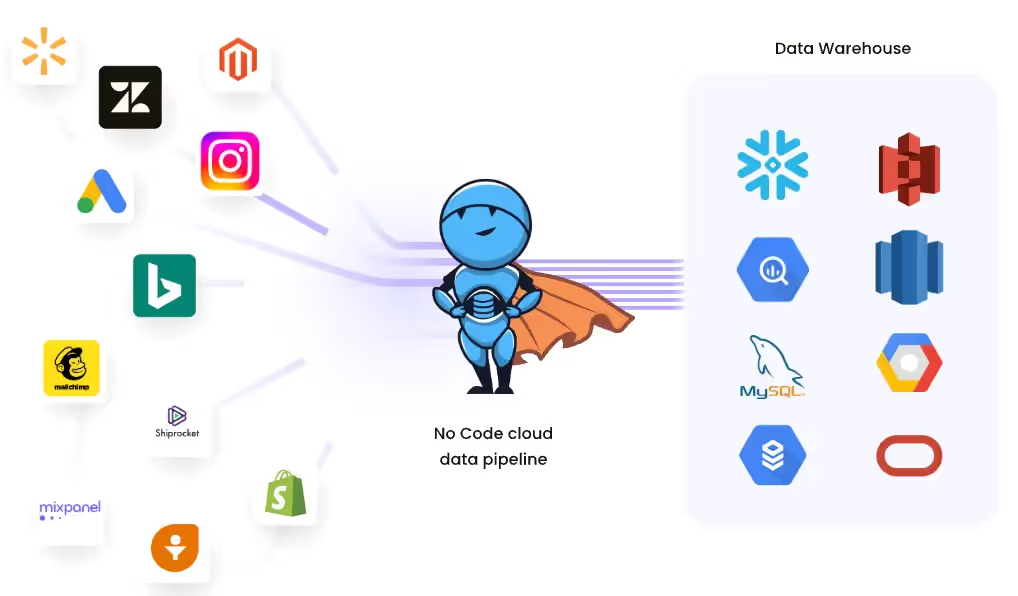
That’s where Saras Analytics comes in. With Saras Pulse, you get a unified view across your Shopify store, ads, CRM, marketplaces, and more. This enables you to uncover not just what is happening, but the why behind it. We’ll get deeper into this comparison.
%20(1).avif)
How Much Does Shopify Analytics Dashboard Cost?
While Shopify analytics dashboard is built into most plans (excluding the Starter tier), the features and depth of insights you get vary significantly across each pricing level. Here’s a breakdown of what’s included by plan:
Source: Shopify Pricing Tiers
Critical Note: The breakdown of these features is crucial for determining which plan is right for your business.
Before upgrading your Shopify plan for better analytics, calculate whether the features gained justify the cost. For some businesses, a platform like Saras Pulse can provide far more insights for a similar investment, especially if you’re also running ads or operating across multiple platforms.
Challenges with Shopify Analytics Dashboard (Why Consider Alternatives)
As useful as the Shopify dashboard is for getting started, many brands eventually hit a ceiling. Here’s where the cracks start to show:
1. Limited Depth and Customization
Shopify’s default reports are not built for strategic teams needing flexible KPIs or complex tracking.
- Can’t build custom funnels or advanced cohort views
- No RFM analysis, LTV segmentation, or predictive modeling
- Filters are basic and non-stackable
Example: Say you want to measure 90-day retention by acquisition of source for your top 5 products. Shopify can’t deliver this natively. Saras Pulse, in contrast, offers SQL-enabled dashboards, user cohort segmentation, and custom retention and churn models.
2. Data Discrepancies and Attribution Gaps
Data discrepancies can arise when comparing Shopify Analytics with other external tools. Attribution models are also basic, which limits accurate tracking of multi-channel marketing efforts.
- Shopify-reported conversions don’t match GA4 or Meta Ads Manager
- Discount codes overwrite source attribution
- Only basic marketing funnel stages are captured
A Coupler.io study found that Shopify attribution misaligns GA4 by 20–30% in many cases a major problem for performance marketers [source].
Saras solves this with advanced multi-touch attribution (first-click, linear, time-decay) across all platforms offering a much clearer understanding of ROI.

3. Integration Challenges
Shopify Analytics is confined to the Shopify ecosystem, making it challenging to consolidate data from other platforms such as Google Ads, social media, or marketplaces. For example, it can be challenging for a multi-brand merchant to compare sales performance across their five stores in a single view using Shopify alone. But with Saras Pulse, this is solved through unified data warehousing (via Saras Daton) and custom dashboards that pull in all your data in one place.
4. Scalability and Cost
As businesses grow, Shopify's native analytics tools may become insufficient, and the higher-tier plans can become costly. So, if you’re spending $400/month on Shopify’s Advanced plan mostly for analytics, you might get better ROI with a custom platform like Saras that includes advanced attribution, inventory forecasting, and marketing insights.
5. User Experience and Complexity
Shopify Analytics can become overwhelming for large stores with extensive data needs, and its user interface can be difficult to navigate for advanced users.
For example, if AOV dropped 20% week-over-week, the dashboard won’t tell you if it was due to a promotion ending, product mix change, or acquisition shift.
Saras Pulse not only shows you the data, but also connects cause and effect across campaigns, customers, and channels, so decisions aren’t left to guesswork.
6. Limited Historical Data Retention
Shopify only stores 13 months of data on most reports unless you manually export or store elsewhere. For long-term trend analysis, YOY growth, or customer lifecycle value modeling, this is a major constraint. On the other hand, Saras Daton allows you to store your data in your own warehouse (AWS, GCP, Snowflake) for as long as you need.
For many businesses, these limitations necessitate a more advanced analytics solution that provides deeper insights, better customization, and stronger integration capabilities.
Shopify Analytics Dashboard vs. Customized Analytics Dashboard with Saras Analytics
How to Create a Customized Shopify Analytics Dashboard
Creating a tailored analytics experience that goes beyond the default Shopify analytics dashboard doesn’t require an army of developers or months of build time. With Saras Daton and Saras Pulse, you can set up a centralized, real-time, and fully customizable Shopify analytics environment in a few steps.
Here’s how to do it:
Step 1: Connect Shopify to Saras Daton
Saras Daton is an ELT (Extract, Load, Transform) tool that pulls raw data from your Shopify store and loads it into your data warehouse (like BigQuery, Redshift, or Snowflake).
Here’s what gets extracted:
Orders (line-item, shipping, tax, discounts), Customers (tags, cohorts, location, history), Products & Variants (inventory levels, SKUs, tags), Checkout and cart events, Refunds and cancellations
No-code setup and automatic schema creation make the process simple, even for non-technical teams.
Step 2: Enrich your Data with External Sources
Once Shopify data is in the warehouse, Saras Daton allows you to connect additional sources like:
- Klaviyo, Mailchimp, Omnisend
- Amazon Seller Central, Walmart
- ERP and inventory systems (NetSuite, Zoho, etc.)
This means you can see your entire customer journey from the first ad click to the final sale, all in one place.
Tip: You can create custom fields to calculate real marketing ROI by combining spend data from Meta with net revenue from Shopify, minus return/refund values.
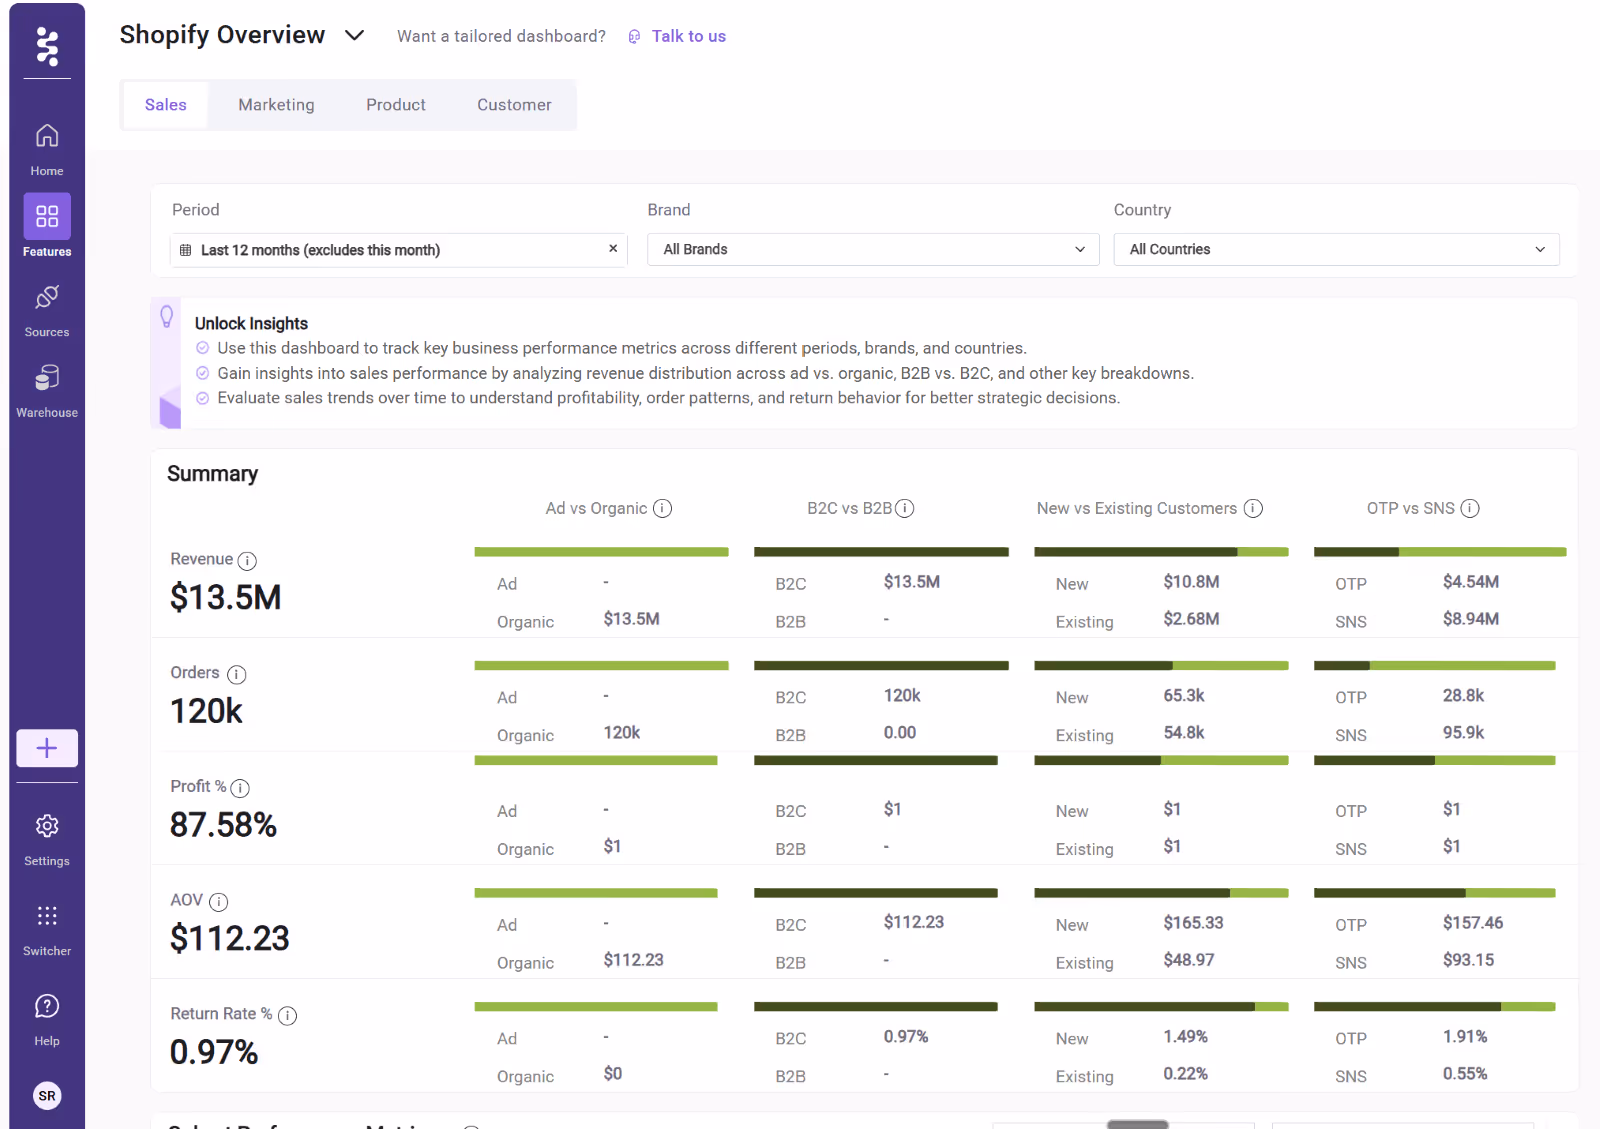
Step 3: Visualize in Saras Pulse
Once the data is unified, Saras Pulse becomes your interface to analyze, visualize, and act.
Here is the Saras Pulse Shopify overview Dashboard:
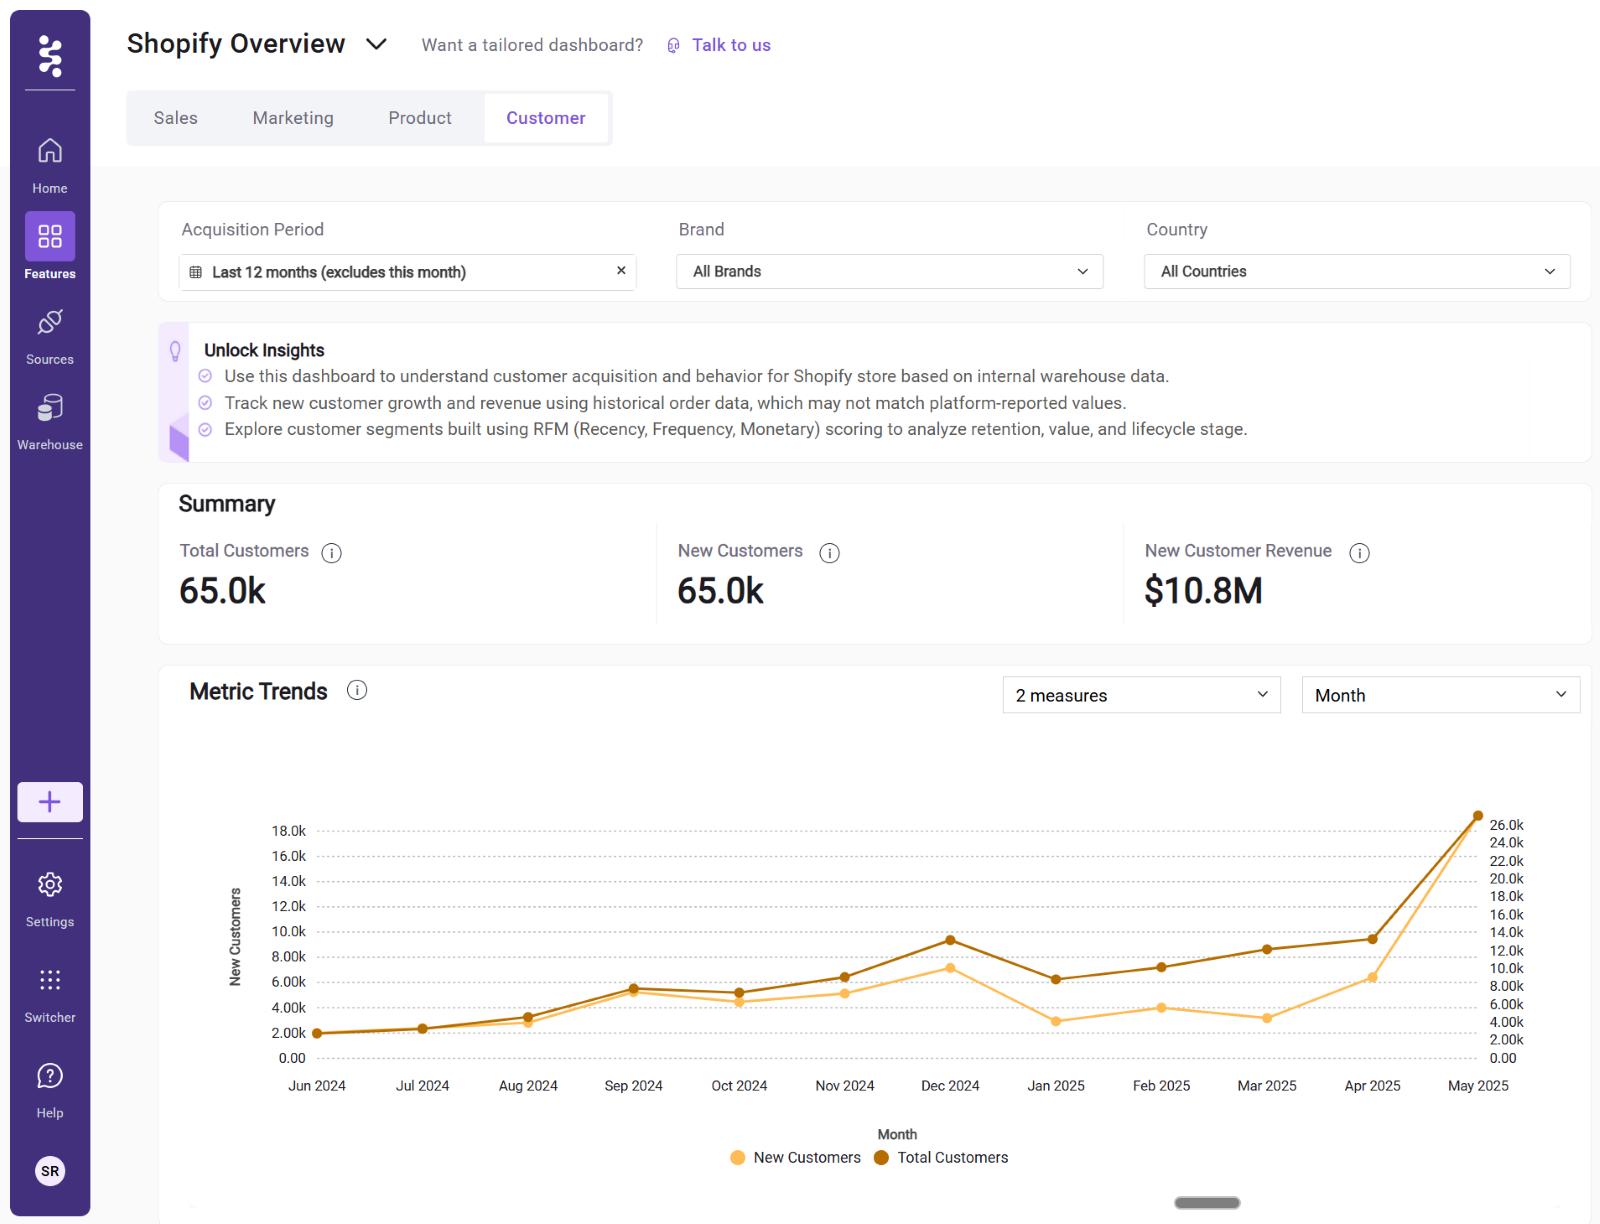
- The dashboard can be customized for specific teams (marketing, ops, execs) and
filtered by store, date, customer cohort, SKU, or source.
Turn Shopify Analytics Data into actionable insights with Saras Pulse
While the Shopify Analytics Dashboard is a great starting point, it may not provide the depth and flexibility needed for growing businesses. Saras Pulse offers:
- Advanced Attribution Models for better campaign ROI tracking.
- Multi-Source Data Integration to unify data from Shopify, Google Ads, and more.
- Custom Dashboards for specific business goals and KPIs.
- Predictive Analytics for smarter decision-making.
Ready to see your entire Shopify performance in one place? Book your personalized Saras Pulse demo today.

.png)
.svg)
%201%20(1).svg)


.png)


.png)


.png)


.png)


.png)


.png)


.webp)


.avif)


.avif)

.avif)
.avif)
.avif)
.avif)
%20(1).avif)
.avif)
%20(1).avif)
%20(1).avif)


.avif)


