
.webp)
By the time a finance team has finished reconciling last month's contribution margin across ad platforms, Shopify, and the ERP, the decisions it was meant to inform are three weeks old. ECommerce analytics tools are supposed to prevent this. The market is projected to reach $28.64 billion in 2026, growing at a 14.51% CAGR, which reflects how many tools exist. Not how well they communicate with each other.
The brands pulling ahead aren't running more tools. They are running fewer, better-integrated ones that treat data as a profit lever rather than a reporting function. This guide breaks down the four analytics domains, which tools lead each category, the G2 ratings that reflect real-world user satisfaction, and how to know when you need a unified platform like Saras iQ rather than another point solution.
Is your data actually Decision-Grade?
9 questions. 3 minutes. Score your Profitability Visibility and Readiness for AI-driven growth.
Start Free Diagnostic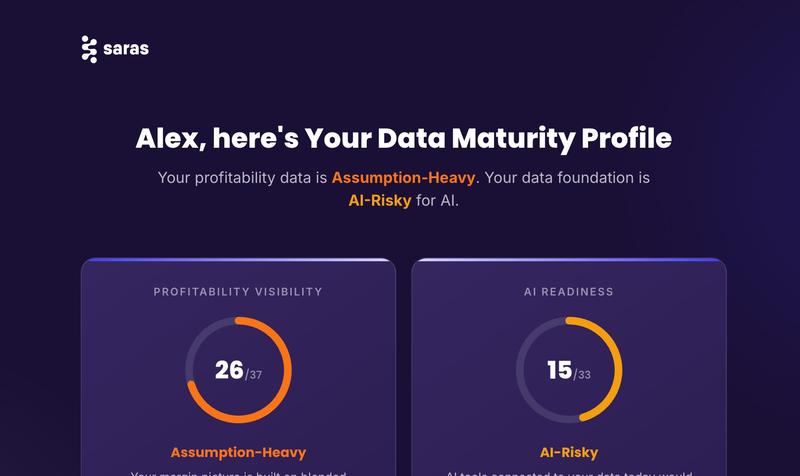
What ECommerce Analytics Tools Actually Do
These tools collect, transform, and present data from your store, ad platforms, fulfillment systems, and customer records. But the category is far broader than most operators realize, and treating all analytics tools as interchangeable is how brands end up with five dashboards that disagree with each other.
The eCommerce analytics software market splits into four distinct domains, each answering a fundamentally different question.
| Analytics Domain | Core Question | Example Tools | What It Cannot Tell You |
|---|---|---|---|
| Behavioral | What are visitors doing on my site? | GA4, Hotjar, Mixpanel | Which channels are profitable after fulfillment costs |
| Attribution | Which marketing channels drove conversions? | Triple Whale, Northbeam | Whether those conversions actually made money |
| Customer & Retention | Who are my best customers and when do they churn? | Peel Insights, Lifetimely | How retention connects to contribution margin |
| Profitability & Unified | Which channels, SKUs, and cohorts drive profit after all variable costs? | Saras iQ, Glew.io, Daasity | N/A (broadest coverage) |
The key insight: most eCommerce brands need coverage across all four domains. That is why asking "what is the single best analytics tool for eCommerce?" produces bad answers. The better question is which domains your current stack covers, which ones have gaps, and whether the reconciliation cost of maintaining separate eCommerce reporting tools has exceeded the cost of unifying them.
Consider a $15M supplement brand running Shopify, Amazon, and a growing TikTok Shop presence. Marketing uses Triple Whale for attribution. The retention team tracks cohorts in Lifetimely. Finance builds contribution margin in a spreadsheet by downloading reports from each platform and manually reconciling them. By the time that spreadsheet is ready, it is mid-month and the decisions it should have informed were already made two weeks ago. That is the fragmentation wall, and it shows up at almost every brand between $5M and $20M.
Profitability and Unified Analytics: The Full P&L Picture
We have heard many times that ROAS is not profit. A channel generating $500K in revenue at a 12% contribution margin is not the same as a channel generating $350K at 38%, but a standard attribution dashboard treats them identically. ECommerce profitability analytics connects ad spend data to COGS, fulfillment costs, returns, and subscription economics to answer the question attribution tools structurally cannot: which channels, SKUs, and customer cohorts make money after all variable costs?
This is also where bundle complexity destroys standard tools. A wellness brand selling component-sourced bundles through Shopify may have six individual ingredients, each from a different supplier, combined into a single SKU.
To do this, a unified platform must meet three criteria: ingest data across your entire tech stack (not just marketing), standardize metrics so finance and marketing share one reality, and adapt to your brand's specific logic for custom COGS and returns.
Here are the platforms engineered to solve this exact profitability gap, starting with the most comprehensive.
1. Saras iQ: Unified ECommerce Data Analytics Platform
Saras iQ is built for brands that have hit the fragmentation wall and need a single certified data layer across marketing, finance, and operations. Rather than adding another point solution, Saras iQ provides pre-built eCommerce data models that unify Shopify, Amazon, paid media, 3PL, ERP, and subscription data.
What it covers:
- Contribution margin by channel: daily, weekly, and monthly CM views with COGS, fulfillment, and ad spend allocated at the order and SKU level. This is the P&L view that attribution tools cannot deliver.
- Customer analytics: cohort analysis, LTV by acquisition channel, churn risk, and repeat purchase rate connected to profitability, not just revenue.
- Marketing attribution: multi-touch models with transparent, auditable methodology across Shopify, GA4, Fairing, and coupon-code data.
- Operations: inventory tracking, demand forecasting, and fulfillment performance across 3PL, FBA, and in-transit inventory.
Saras iQ sits on top as an AI eCommerce analyst that answers questions in plain English without SQL, with every answer traceable to the underlying certified data. The critical distinction: plugging an LLM directly into a raw data warehouse yields unreliable answers because the AI does not know how a specific brand calculates contribution margin or handles returns. Saras iQ builds the semantic context layer first, so the AI layer produces trustworthy outputs.
"We go to Saras iQ and get our daily contribution margin reporting. We get all of our marketing metrics by channel, by category, even down to the SKU. Everything is pulled in automatically." — Jason Panzer, President, HexClad
Best for: Brands at $15M+ revenue running multiple channels (Shopify + Amazon + wholesale) where reconciling numbers across tools takes more time than acting on insights. G2 Rating: 4.7/5
2. Glew.io: Multi-Channel Reporting for Mid-Market
Glew bundles a managed data warehouse with 170+ integrations and pre-built KPIs spanning product performance, customer LTV, and cross-channel reporting. A solid mid-market option for brands that need consolidated reporting without a full enterprise data build. Its Plus plan includes Looker-based dashboards and custom warehouse access.
Limitations: setup documentation can be thin for custom connectors, and the standard reporting tier may not go deep enough for finance-grade CM. Pricing starts with a free trial; paid plans scale by integration count. G2 Rating: 4.0/5
3. Daasity: Data Engineering Layer for Custom BI
Daasity extracts, transforms, and loads eCommerce data into your warehouse (Snowflake or BigQuery) for custom dashboards in Looker, Tableau, or Power BI. The right choice for brands with an internal analytics team that wants full SQL access and custom modeling. The Looker-based interface is powerful but has a steep learning curve, and brands without a dedicated analyst may struggle to get value.
Behavioral ECommerce Analytics Tools: What Happens on Your Site
Behavioral tools answer the conversion optimization question: where are customers dropping off, what catches their attention, and what drives them to buy? Every eCommerce brand needs at least one. These tools are the most mature category in the market.
1. Google Analytics 4: The Universal Baseline
GA4 is free, required, and still the starting point for eCommerce analytics. The real value is in Explorations: funnel analysis, path analysis, and cohort reports that reveal where revenue leaks happen. The standard reports are surface-level. Limitations have grown since iOS privacy changes: cross-device tracking is increasingly unreliable, data sampling kicks in at high volumes on the free tier, and there is no native first-party attribution.
GA4 360 starts at approximately $50,000/year. Every eCommerce store should have GA4 configured correctly as the baseline behavioral layer, paired with a dedicated attribution tool for paid media accuracy.
2. Hotjar: Visual Behavior Intelligence
Heatmaps, session recordings, and feedback surveys that show exactly where customers click, scroll, and abandon. The strongest tool for understanding the "why" behind conversion rate data. The free plan includes unlimited heatmaps and 35 daily sessions. Note: the Contentsquare acquisition creates some uncertainty about long-term product direction. Paid plans from $49/month. G2 Rating: 4.3/5
3. Mixpanel: Event-Based Product Analytics
Cart analysis at the item level, cohort tracking, and funnel reports that go deeper than GA4's standard eCommerce reports. Mixpanel repositioned for eCommerce analytics for Shopify and other platforms in 2025-2026, adding cart-level analysis that shows what was in a shopper's cart at every point in their journey. Free tier available up to 1M events/month. G2 Rating: 4.6/5
Attribution ECommerce Analytics Tools: Which Marketing Drives Sales
Attribution tools answer the paid media question: which channels, campaigns, and creatives are driving revenue independent of what the ad platforms themselves claim? This category matters because Meta, Google, and TikTok all over-count their own conversions when run simultaneously.
Watch for this signal: If you are running paid campaigns across three or more platforms and each one claims credit for the same purchase, you are counting the same revenue two or three times. Platform-native ROAS will always look better than reality. An independent attribution tool corrects for this inflation.
1. Triple Whale: Best Entry Point for DTC Analytics Tools
The most accessible independent attribution layer for Shopify-native brands. Clean profitability dashboard combining CAC, ROAS, LTV, and margin by channel. The AI assistant (Moby) enables natural language queries across your data. Over 50,000 eCommerce brands use it.
Limitations: Shopify-centric, attribution methodology is not fully transparent, and better suited for operational pacing than deep analytical work. Pricing starts with a free tier; paid plans from approximately $1,490/year. G2 Rating: 4.5/5
2. Northbeam: For Brands Spending $50K+ Monthly on Paid Media
The most rigorous attribution platform for serious performance marketers. Multi-touch attribution, media mix modeling, incrementality testing, and creative-level analytics across every channel. Deterministic view-through attribution launched in late 2025 closed the video attribution gap.
Limitations: minimum ~$1,500/month, 2–4 week calibration period, steep learning curve. Built for teams with a dedicated media buyer, not solo operators. Contact sales for current pricing. G2 Rating: 4.7/5
Customer and Retention Analytics: Who Your Best Customers Are
Acquisition-only analytics is a 2020 mindset. The brands building durable profitability in 2026 understand cohort behavior, predict LTV early, and know exactly when and why customers churn. This category answers the questions that drive retention strategy.
1. Lifetimely: Affordable LTV and Cohort Analysis
Purpose-built for Shopify LTV and cohort analytics. Tracks customer lifetime value, repeat purchase rates, and cohort behavior over time. One of the most affordable entry points for retention analytics. Pricing starts from $49/month.
2. Peel Insights: Retention Analytics for DTC Brands
Automated cohort analysis, customer segmentation, and retention metrics designed for DTC brands that need LTV and churn visibility without a data analyst building reports manually. G2 Rating: 4.5/5
The gap these tools leave is the connection between retention and profitability. Tracking LTV by cohort is valuable, but LTV measured as net revenue and LTV measured as contribution margin produce very different answers.
A CFO at a $50M supplement brand put it this way during a recent evaluation: returning customers generate roughly 45% of total revenue and are effectively funding fixed expenses and CAC for new buyers. If your retention tool tracks LTV but not CM, you cannot tell whether acquiring those repeat customers again is actually profitable. Cohort analysis and LTV tracking connected to contribution margin is where retention decisions get operationally sharp.
How to Choose the Right ECommerce Analytics Tool for Your Brand
The best analytics tools for your brand depend on your revenue stage, channel complexity, and which questions your current stack cannot answer. Here is a practical framework:
- Under $1M revenue: GA4 (free) plus Lifetimely or Peel for LTV. Understand cohort behavior before investing in sophisticated tools. Keep analytics spend lean until you have enough data to act on.
- $1M to $5M, primarily Shopify: GA4 plus Triple Whale for attribution plus Lifetimely for retention. This stack covers behavioral, attribution, and LTV for under $200/month combined. Add Hotjar if conversion rate optimization is a priority.
- $5M to $20M, multi-channel: The fragmented stack becomes a real problem here. Attribution, retention, and profitability data live in three different tools with three different definitions of the same metrics. Consider Saras iQ as the unifying layer, or Glew.io as a mid-market bridge.
- $20M+ revenue, omnichannel (DTC + Amazon + wholesale): You need a unified analytics platform, not a stack. Saras iQ connects all channels, including Amazon Seller Central, 3PLs, and ERP systems that consumer analytics tools miss entirely, through 200+ eCommerce data connectors into a single certified data foundation.
- Any brand where the CFO or board is asking "what is our actual profitability by channel?": None of the tools in the behavioral, attribution, or retention categories answer this question. Contribution margin analytics requires a data layer that connects ad spend to COGS, fulfillment, and returns.
Watch for this signal: If your team spends more time reconciling numbers across tools than acting on insights, the cost of the fragmented stack has already exceeded the cost of a unified platform.
True Classic unified 40+ disconnected tools into one data ecosystem through Saras iQ, saving over 1,000 analyst hours annually. Read the full case study →
Selection Criteria for Any Analytics Platform: A Checklist
Six selection criteria worth evaluating regardless of which domain you are shopping in:
Conclusion
The eCommerce analytics market is large, fast-growing, and genuinely confusing. The right approach is not finding the single best tool. It is being clear on which questions you need answered and building a stack, or choosing a platform, that covers all of them without producing conflicting numbers.
For brands early in their analytics journey, start with GA4 and one attribution tool. For brands that have hit the fragmentation wall, where every team looks at different numbers and the CFO's spreadsheet does not match the marketing dashboard, Saras iQ replaces the stack with a single source of truth. Talk to the Saras data consultants to see what a unified analytics foundation looks like for your specific channel mix.

.svg)
.webp)
%201%20(1).svg)







.jpg)





%20Statistics%20in%202026.jpg)



%20Software%20for%20DTC%20Brands%20in%202026.png)







%20Setup%20Guide%20for%20Ecommerce%20Finance%20Team.png)

























.webp)

.webp)
.webp)
.webp)
.webp)















.webp)