


When ecommerce teams review their numbers, retention is usually the first red flag. Almost 7 in 10 first-time customers don’t buy again from Shopify stores. This is mainly because data lives in too many places (like Shopify, Amazon, Meta Ads, Klaviyo, GA4, paid channels, and subscription tools). A customer retention dashboard connects these sources into a single, real-time view of repeat purchases, churn risk, cohort performance, and LTV.
This is where the “data as ROI” story actually becomes real. Once retention data lives in one place, it stops being a historical report and turns into a forecasting tool, showing how cohorts behave, where churn will hit future revenue, and how LTV compounds over time. In short, the dashboard becomes the planning engine behind sustainable growth.
Adobe’s 2024 Digital Economy Index shows that returning customers spend nearly three times as much as new buyers, making even minor improvements in retention meaningful. But without a centralized dashboard, teams can’t spot churn risk early, understand what drives repeat orders, or link their acquisition channels to long-term customer value.
In this article, we’ll cover:
- What a customer retention dashboard is
- Why it matters for ecommerce and DTC teams
- The KPIs and metrics worth tracking
- Key dashboard types and their use cases
- Common challenges with retention reporting
- Build vs. buy considerations
- Top retention dashboard tools for 2026
You’ll also see how modern retention intelligence platforms like Saras Analytics help ecommerce brands reduce churn, improve LTV, and make faster, data-driven decisions.
What Is a Customer Retention Dashboard?
A customer retention dashboard is a centralized analytics view that helps ecommerce teams understand how customers return, how their spending changes over time, and when they are likely to churn. Instead of pulling data from multiple tools, the dashboard brings all retention signals together so teams can see repeat purchase behavior, cohort trends, and long-term customer value in one place.
.webp)
With this unified view, ecommerce teams can quickly answer the questions that matter most:
- Which customers are returning?
- Who is at risk of churning?
- Which channels bring the highest-LTV cohorts?
- What product or category choices influence repeat purchases?
By consolidating this information, the dashboard makes it easier to spot retention patterns, understand cohort behavior, and identify what drives long-term customer value.
Why Customer Retention Dashboards Matter
Understanding why a customer returns or drifts away explains why a customer retention dashboard gives ecommerce teams the fuller picture that individual tools simply can’t.
For many ecommerce operators, retention questions pile up quickly:
Why did this cohort stop buying? Which channel brings customers who stay longer? Why did repeat purchases dip this month? Without a unified view, those answers remain scattered and slow to uncover.
A customer retention dashboard helps brands in the following ways:
- Make data-backed retention decisions: Spot churn windows, monitor repeat purchase behavior, and see how customers move across cohorts.
- Increase repeat purchase rate: Identify patterns in replenishment, product affinity, and cross-sell opportunities.
- Reduce churn proactively: Detect early signs of disengagement and activate targeted CRM campaigns before customers lapse.
- Optimize marketing spend: Assess CAC, ROAS, and acquisition channels based on long-term LTV, not just first-order revenue.
- Improve the customer experience and personalization: Use behavioral data and segmentation to tailor messages, offers, and retention workflows.
Modern retention intelligence platforms bring these capabilities together, helping ecommerce teams move beyond basic reporting to a clearer, real-time understanding of what drives customer loyalty.
Must-Have Metrics and KPIs in a Customer Retention Dashboard
A retention dashboard brings the right KPIs together so teams can see how customers return, when they churn, and what drives long-term value.
The tables below break down the metrics that matter, how to calculate them, and why ecommerce teams rely on them.
Retention KPIs
LTV KPIs
Behavior KPIs
Marketing Impact KPIs
Operational Retention KPIs
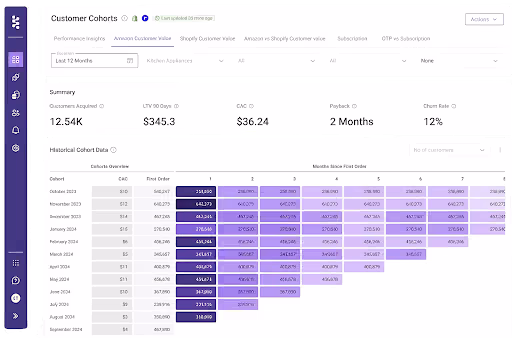
A customer retention dashboard brings all of these metrics into one place. Saras Pulse includes each of these KPIs out of the box with no custom BI setup, no manual data stitching, and no complicated formulas.
Types of Customer Retention Dashboards
This section breaks down the dashboards ecommerce teams rely on most so you know exactly what each one is built to answer.
1. Cohort Analysis Dashboard
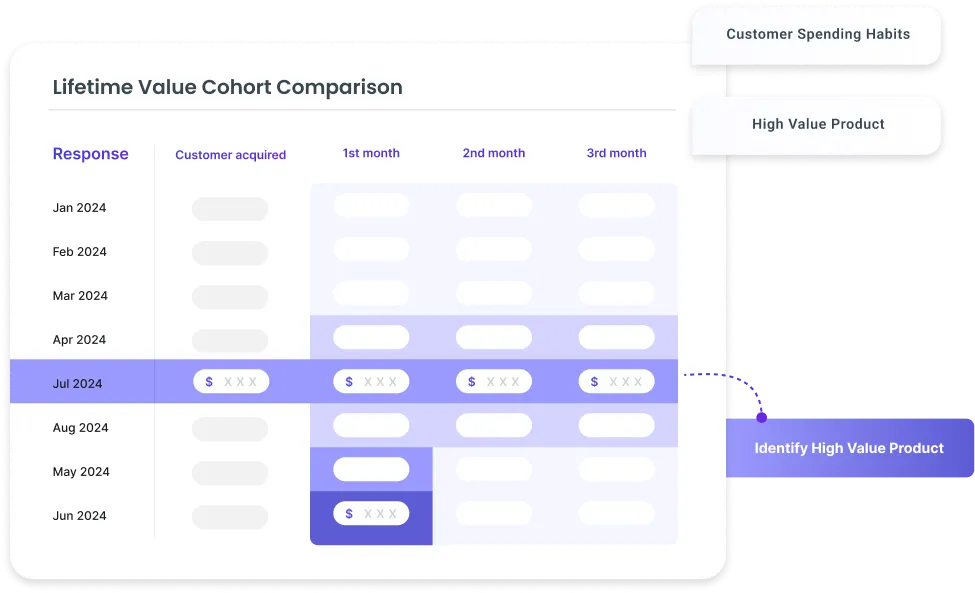
This dashboard shows how groups of customers (acquired in the same month/week) behave over time.
Key insights:
- Retention rates by Month 1, Month 2, Month 3
- Churn windows
- Purchase frequency across cohorts
- Cohort-specific AOV and LTV
Cohorts reveal the true health of your acquisition and retention strategy better than any overall average.
2. Lifetime Value (LTV) Dashboard
LTV dashboard tells about how customer value evolves across channels, cohorts, and segments.
Key insights:
- LTV by acquisition source
- LTV vs CAC payback
- Predictive LTV for new customers
- LTV by product line or first SKU purchased
This dashboard helps shift teams from first-order ROAS to long-term profitability.
3. Repeat Purchase & Frequency Dashboard
When you study how customers return, distinct patterns emerge around what prompts their next purchase.
Key insights:
- Time between purchases
- Average order cycle
- Replenishment windows
- Drop-off points between purchases
This is great for CPG, beauty, pet care, wellness, and any brand driven by replenishment cycles.
4. Customer Segmentation Dashboard

This shows which customers are high-value, at-risk, or inactive, along with how these groups behave over time.
Key insights:
- RFM segmentation
- High-LTV vs low-LTV segments
- At-risk segments for CRM targeting
- Dormant customers ready for win-back
Segmentation helps teams run targeted CRM campaigns instead of broad promotions, making every message more relevant and effective across different customer groups.
5. Marketing Influence on Retention Dashboard

This shows how different marketing channels, campaigns, and touchpoints contribute to second purchases, repeat buying behavior, and long-term customer value.
Key insights:
- Channel-wise repeat purchase rate
- CRM campaign performance
- Paid vs organic returning customer share
- Impact of discounts or offers on retention
This dashboard helps teams understand which acquisition and CRM strategies genuinely influence returning customers, allowing smarter budget allocation and more effective retention-focused marketing decisions.
Platforms like Saras Pulse lets ecommerce teams switch between cohorts, LTV, segmentation, and repeat purchase insights without building anything from scratch.
Challenges With Creating a Customer Retention Dashboard
Building a retention dashboard sounds simple until you start pulling data from every tool. This section highlights the hurdles ecommerce teams run into and why retention reporting often breaks down before it delivers value.
1. Data Integration Issues
Connecting Shopify, Amazon, GA4, Klaviyo, Meta Ads, CRM platforms, subscriptions, and support tools usually means dealing with mismatched schemas, missing fields, and unreliable stitching between customers and orders.
Solution: Use a unified data pipeline like Saras Daton to pull clean, standardized retention data from all sources without manual engineering.
2. Data Accuracy & Attribution Gaps
LTV looks different in Shopify vs GA4 vs subscription tools, repeat purchases get double-counted, and paid channels receive credit for returning buyers they didn’t influence. These inconsistencies make it impossible to trust the numbers.
Solution: Platforms like Saras Pulse apply consistent models for LTV, cohorts, and attribution so teams are working from one version of the truth.
3. Limited Drill-Down in Many Tools
Most ecommerce dashboards give just averages. You can’t filter by SKU, offer, channel, campaign, region, or subscription status, making it hard to identify what’s actually driving retention.
Solution: Pulse allows deep cohort and segment drill-downs across product, channel, geography, discounting, and campaign attributes.
4. Manual Retention Reporting
Teams spend hours exporting CSVs from Shopify, Klaviyo, Amazon, and ad platforms and stitching them together for weekly retention reports. This slows down insights and introduces errors.
Solution: Pulse automates cohort, LTV, and repeat purchase reporting so your dashboards update in real time.
5. Privacy & Security Concerns
Customer data often sits across multiple systems and files, increasing the risk of exposure or non-compliance. This becomes more challenging as teams handle PII across email, orders, and CRM events.
Solution: Saras’ infrastructure is built for enterprise-grade data governance and secure handling of sensitive customer and transactional data.
Build vs Buy: What’s Better for Your Customer Retention Dashboard
When teams outgrow spreadsheets, the first question is whether to build a custom dashboard or choose a ready-to-use platform. This table lays out the trade-offs so you can choose the path that fits your team, budget, and data maturity.
If your team has the engineering capacity to design, maintain, and scale a full retention stack, building may make sense. But for most ecommerce brands, buying a prebuilt retention intelligence platform delivers faster insights, lower cost, and significantly more accuracy.
Top 5 Customer Retention Dashboards in 20265
Very few tools are built specifically to help ecommerce teams understand why customers return or churn. This section compares the leading retention dashboards so you can see which platforms support ecommerce needs.
1. Saras Pulse
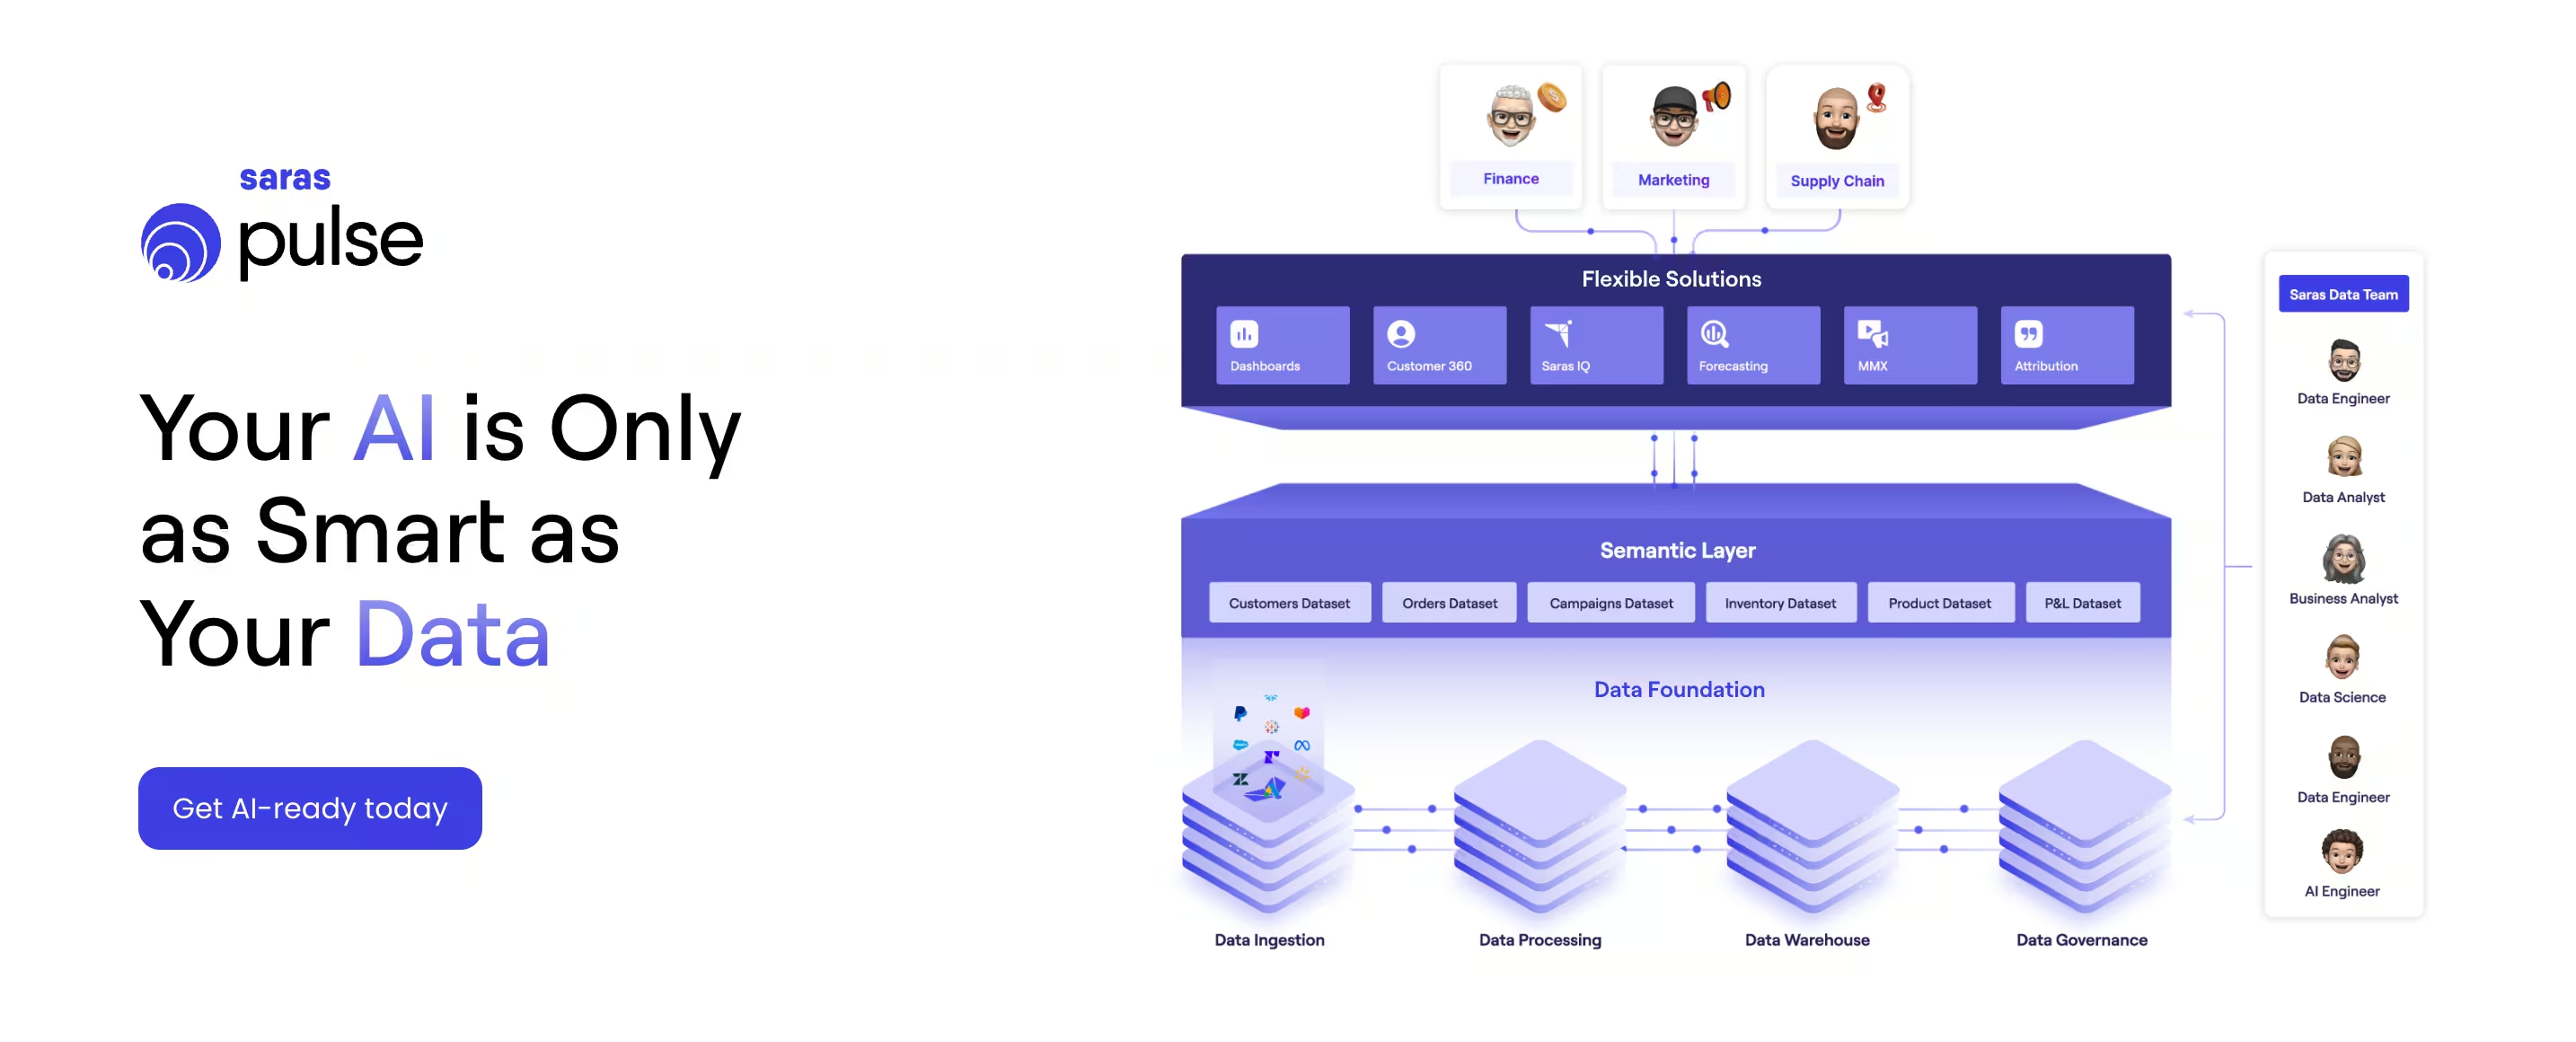
Saras Pulse is a turn-key reporting and intelligence layer built for ecommerce and omnichannel brands. Sitting atop Saras Daton’s unified data pipelines, it converts disconnected sales, marketing, operations, and finance data into AI-ready datasets and dashboards for a single business view.
Compared to generic BI tools or lightweight dashboard apps, Pulse combines e-commerce-native models with a dedicated data team.
It is built for brands that are beyond “spreadsheet reporting” and want to improve customer retention, forecast growth with ~95% accuracy, and turn their data into a high-ROI channel rather than a cost center.
Key Features
- Customer 360 & advanced cohorts that map CLTV across segments, channels, and products
- Cohort and retention dashboards to monitor the impact of initiatives on churn and repeat purchases in real time
- Churned high-value customer tracking to identify recently lost customers and trigger targeted win-back outreach
- Omnichannel sales visibility across Shopify, Amazon, and other channels in one view, including SKU-level performance
- Predictive analytics and forecasting to plan growth, inventory, and revenue with high confidence
- Pre-built dashboards for marketing, customer analytics, operations, and finance, tailored to ecommerce and retail teams
- Backed by Saras’ data team, acting as an embedded analytics partner rather than a standalone tool
Pricing
Custom, subscription-based pricing depending on data volume, channels, and scope. Designed to replace multiple disconnected tools and reduce overall data stack costs.
Pros
- Built specifically for ecommerce and omnichannel brands
- Real-time cohort and retention tracking, validated by customer case studies
- Strong customer 360 and CLTV analysis across segments and channels
- Deep ecommerce expertise and strategic guidance from the Saras team
- Helps eliminate reporting chaos and manual data stitching
Cons
- Not suited for non-ecommerce or generic enterprise analytics use cases
- Works best when brands commit to consolidating their data stack into a single source of truth
- Requires initial alignment across teams (marketing, finance, ops) on key metrics and definitions
Best For
D2C and omnichannel ecommerce brands that want a unified retention and revenue intelligence platform instead of piecing together multiple BI, ETL, and analytics tools.
2. Klipfolio
Klipfolio is a customizable dashboard and reporting platform used by teams that need to pull data from spreadsheets, APIs, CRM tools, and cloud apps. It offers a spreadsheet-like builder and 200+ connectors, making it a suitable option for agencies, marketing teams, and SMBs that want flexible reporting without investing in complex BI tools.
While Klipfolio is versatile, it isn’t built specifically for ecommerce retention analytics. Implementing deep LTV, cohort, or churn modeling requires manual setup, formulas, and ongoing maintenance, which may not suit teams looking for plug-and-play ecommerce insights.
Key Features
- 200+ integrations pull data from spreadsheets, CRMs, SQL sources, and other tools.
- Custom dashboard builder lets you create reports with formulas & visual widgets.
- Automated refresh keeps dashboards up to date via near-real-time data pulls.
- White-label support helps agencies deliver branded, client-facing reporting.
- PowerMetrics centralizes KPIs for teams that want metric-level tracking.
Pricing
Plans start at $120/month when billed annually. Add-ons like priority support, white-labeling, and near-real-time refresh incur extra costs.
Pros
- Highly customizable dashboards
- Large integration library
- Strong for agencies and service providers
- Affordable entry pricing
Challenges
- Not designed specifically for ecommerce retention or cohort analysis
- Manual setup required for LTV, churn, and repeat purchase modeling
- More complex for non-analysts
- Requires spreadsheet-style logic for advanced calculations
Best For
Teams that need flexible, general-purpose dashboards rather than an ecommerce-specific retention intelligence platform.
3. Yotpo
Yotpo is a retention marketing suite built for ecommerce brands that want to improve repeat purchases through reviews, user-generated content, loyalty programs, and referrals. The platform helps teams collect high-quality reviews, personalize loyalty incentives, and encourage customers to advocate for the brand. While Yotpo excels at engagement and loyalty mechanics, its retention analytics are less comprehensive than tools focused specifically on cohort and LTV intelligence.
Yotpo is ideal for brands prioritizing loyalty and engagement workflows (not deep retention modeling). It pairs well with email/SMS ecosystems but offers limited visibility into cohort curves, multi-channel LTV, or underlying purchase drivers compared to Saras Pulse.
Key Features
- AI-assisted review collection & multilingual review displays for on-site social proof
- Loyalty & referral program builder with 20+ prebuilt reward campaigns
- Personalized loyalty experiences through branded earning and redemption rules
- Integrations with Shopify, Salesforce Commerce Cloud, and 180+ martech tools
- Review summaries and theme detection powered by AI for decision-making
Pricing
Yotpo pricing varies by module. Reviews start at $79/month, Loyalty starts higher and includes custom pricing for premium tiers. Costs scale with order volume and specific feature bundles.
Pros
- Strong loyalty ecosystem with proven CLTV lift
- AI-driven review display and collection tools
- Wide martech integrations for multi-channel engagement
- Powerful out-of-the-box campaigns for retention teams
Challenges
- Retention analytics are shallow (lacks cohorts, predictive LTV, and multi-source modeling)
- Pricing escalates quickly as order volume grows
- Full value often requires using multiple Yotpo modules
- Setup can be heavy for non-Shopify merchants
Best For
Brands that want retention marketing through loyalty and reviews, not advanced retention analytics. Yotpo strengthens engagement, but teams needing deeper cohort insights, unified LTV, or multi-channel retention modeling will need a complementary analytics platform like Saras Pulse.
4. Amplitude
Amplitude is a digital analytics platform built for product, growth, and marketing teams that need to track user behavior, run experiments, and tie feature usage to revenue. It combines product analytics, marketing analytics, session replay, and experimentation in one interface, with newer AI layers like AI Agents, AI Feedback, and AI Visibility.
In this comparison, Amplitude works best as a behavior and journey analytics layer. It can inform retention strategy, but it is not ecommerce-specific and does not give the same pre-modeled, omnichannel retention and LTV view that Saras Pulse offers out of the box.
Key features
- Event-level product and web analytics with behavioral cohorts and funnels
- Feature and web experimentation for A/B and multivariate tests
- Session replay and heatmaps tied to event data
- Warehouse-native option to sit directly on Snowflake or other clouds
- AI Agents and AI Feedback to surface insights and synthesize customer signals
Pricing
- Starter: Free, up to 50K MTUs and 10M events
- Plus: From $49/month, with higher MTU/event limits and more features
- Growth & Enterprise: Custom pricing based on volume and controls
Pros
- Strong behavioral analytics and experimentation in one suite
- Good AI assistance for analysis and feedback
- Warehouse-native option for mature data teams
Challenges
- Not tailored to ecommerce retention or cohort economics
- Requires clean event tracking and implementation effort
- Can be overkill if you only want prebuilt retention dashboards
Best for
Digital product and growth teams that want deep behavior analytics and testing, and are willing to model ecommerce retention and LTV on top, or alongside a tool like Saras Pulse.
5. Peel
Peel is a retention and cohort analytics platform built for Shopify and DTC brands. It pulls data from Shopify, Amazon, Walmart, GA4, ad platforms, Klaviyo, and subscription. It goes much deeper than generic tools on repurchase behavior and cohort economics, but it doesn’t try to be a full product analytics or experimentation suite like Saras Pulse or Amplitude.
Key features
- Centralizes Shopify, Amazon, Walmart, GA4, Klaviyo, and subscription data into one source of truth
- 30+ cohort, LTV, subscription, product, and journey KPIs pre-modeled for ecommerce
- Purpose-built reports like Market Basket Analysis, RFM, audience traits, city-level repurchase, and product sales
- Prebuilt and custom dashboards with drill-down slices, templates, and easy exports
- Automated insights via daily Slack/email digests and scheduled CSV/report delivery
Pricing
- Core: From ~$179/month (or $199/month), for ~6,000+ monthly orders
- Essentials: From ~$449/month, for ~16,000+ monthly orders with extra CSM support
- Accelerate: From ~$809/month (or $899/month), for ~29,000+ monthly orders
- Tailored: Custom pricing for 62,000+ monthly orders and above
Pros
- Built specifically for Shopify and DTC retention/subscription analytics
- Rich library of ecommerce-first templates that answer real LTV and repurchase questions
- Strong support, including onboarding, email/chat, and Slack (on higher tiers)
- Helps non-technical marketers and retention leads work without a data team
Challenges
- Most value is for Shopify/DTC; less relevant for non-ecommerce products
- No native experimentation or in-app messaging layer
- Pricing moves with order volume, which can add up for very high-GMV brands
Best for
Shopify and DTC brands (especially on Shopify Plus and Amazon) that are serious about retention, subscription growth, and LTV, and want deep, ready-made cohort and product analytics without building their own warehouse or hiring a dedicated analytics team.
How To Choose The Right Retention Analytics Platform
You’ve reached the point in the article where the big question kicks in: “Okay, but how do I actually pick the right retention dashboard?”
That’s where a good evaluation framework helps. Instead of drowning in feature lists or demo hype, these criteria show you what really matters when comparing tools.
Why Growing Ecommerce Brands Choose Saras for Customer Retention Dashboards
As you look across the tools we've covered, you can see that most platforms focus on either behavior analytics, product analytics, or marketing insights. A few specialize in ecommerce, but still leave teams stitching together retention drivers, LTV shifts, campaign influence, and customer-level economics across disconnected dashboards. That fragmentation is exactly what growing ecommerce brands are trying to move away from.
Saras Pulse gives teams an e-commerce-native retention layer without needing data engineers, custom tracking, or manual modeling. With pre-built repeat-purchase dashboards, automated cohorts, SKU-level insights, CLV forecasts, and customer-level identifiers, every team works from a single source of truth. And because it updates automatically from Shopify, teams can move from guessing repurchase drivers to acting on precise retention signals.
Saras helps teams answer the questions that move revenue, like who’s coming back, why they return, what triggers the next order, and which experiences build long-term loyalty.
If you’re ready to run retention with more confidence and less guesswork, Talk to our Data Consultants and see how quickly the right insights can change your growth curve.

.svg)
.png)
%201%20(1).svg)


.png)


.png)


.png)


.png)


.png)


.png)


.webp)


.avif)


.avif)

.avif)
.avif)
.avif)
.avif)


