


Your eCommerce contribution margin looked like 22% all quarter. Then the books closed, and the real number was 14%. Eight points gone. No single catastrophic event caused it. No pricing mistake, no failed campaign, no inventory write-off large enough to trigger an alert. Instead, thousands of small leaks across returns, shipping surcharges, and platform fees quietly drained margin from individual orders faster than the daily dashboard could track. By the time finance reconciled the actuals, the quarter was already over.
That pattern repeats at DTC brands of every size, and it persists because the leaks happen at the order level while most teams monitor margin at the P&L level. Contribution margin visibility, measured per order, per SKU, and per channel, is the only way to catch these leaks while they are still small enough to fix. This article maps the three largest categories of eCommerce margin leakage, shows how each one compounds, and outlines how to detect them before they reach the month-end close.
Is your data actually Decision-Grade?
9 questions. 3 minutes. Score your Profitability Visibility and Readiness for AI-driven growth.
Start Free Diagnostic
The Anatomy of Margin Leakage
Margin leakage is the gap between the profit you expect based on your gross margin and the profit you collect after every variable cost settles. That gap exists because gross margin only accounts for COGS. It ignores the constellation of variable costs that sit between a completed sale and actual cash: return processing, carrier fees, fulfillment labor, platform commissions, and payment gateway cuts.
Why gross margin creates false confidence
A brand running 55% gross margin looks healthy. But if returns consume 6% of revenue, shipping and fulfillment take 12%, marketplace fees absorb 8%, and payment processing clips another 2.8%, the actual contribution margin is 26.2%. That is less than half the gross margin number. Every percentage point of margin erosion that goes undetected for a month compounds across tens of thousands of orders before anyone spots it.
The reconciliation timing trap
The second structural problem is timing. Operational dashboards show margin based on estimated costs at the point of sale. Actual costs, particularly carrier invoices and return processing fees, arrive weeks later.
Joe Cohn, CTO of LybCorp, described the old reality: "Our monthly financials used to take 10+ days to reconcile. Now we've brought that process down to just a few hours." That 10+ day reconciliation gap is where margin leakage hides: between the margin you see during the month and the margin finance confirms after the month closes.
Leak #1: The Compounding Cost of Returns
Returns are the largest and most underestimated source of margin erosion in eCommerce. NRF and Happy Returns report that $849.9 billion in merchandise was returned in the U.S. in 2025, with an estimated 19.3% of online sales coming back. Each return is a margin event, not just a revenue reversal.
The double hit
When a customer returns a product, the revenue disappears but the costs do not. The brand has already paid for outbound shipping, the acquisition cost that drove the sale, and the fulfillment labor to pick and pack the order. On top of that, the return generates new costs: a return shipping label, 3PL receiving and inspection, restocking labor, and customer service time. McKinsey estimates that retailers spend roughly $200 billion annually on reverse logistics alone. At the individual order level, processing a single return costs $20-$30 when all of these components are loaded in.
The unsellable trap
For brands in supplements, cosmetics, or food, hygiene regulations often mean returned inventory cannot be resold at all. A returned protein powder or opened skincare product becomes a full write-down: the COGS is lost, the sale is reversed, and the return costs are absorbed. Even in apparel, damaged packaging, missing tags, or wear-and-return abuse ("wardrobing") can push a returned item to the liquidation pile at 20-40 cents on the dollar. The returns distort contribution margin far more than most forecasts account for.
Return rate disparities by SKU and channel
Not all products return at the same rate. A sizing-dependent apparel SKU might see 28% returns while an accessory SKU from the same brand sits at 6%. Acquisition channel matters too: customers acquired through aggressive discount campaigns or "try before you buy" promotions return at significantly higher rates than organic or repeat buyers. When return costs are spread as a blended average across the catalog, the 6% return SKU quietly subsidizes the 28% SKU, and 3PL charges impacting contribution margin on the high-return product remain invisible.
Consider a hypothetical supplements brand running a subscription model. One SKU has a 22% return and cancellation rate, driven by first-month subscriber churn. Each return costs $28 fully loaded: $7 outbound shipping already absorbed, $6.80 return label, $5.50 3PL processing and inspection, and $8.70 in product write-down (hygiene rules prevent resale). At 800 returns per month on that single SKU, the brand absorbs $22,400 in costs that the P&L shows as a single "returns" line. Fixing that leak requires knowing which SKU, which channel, and which customer cohort is generating it.
Leak #2: The Hidden Realities of Shipping and Fulfillment
Shipping and fulfillment is the second largest leak category, and one of the hardest to pin down because the costs arrive after the sale, change quarterly, and vary by dimensions most forecasting models do not track.
The dimensional weight surprise
Carriers price shipments based on whichever is greater: actual weight or dimensional weight (length x width x height divided by a carrier-specific divisor). A lightweight but bulky product, like a foam pillow or a hat in a large box, can incur shipping costs two to three times higher than a weight-based estimate would suggest.
Many brands price their products and set free-shipping thresholds based on actual weight assumptions. When dimensional weight pricing kicks in, the margin on those specific orders erodes without any visible signal in the daily dashboard. This is one of the core reasons why fulfillment costs are eroding margin at brands that recently expanded their product catalog into larger or oddly shaped items.
Zone adjustments, surcharges, and carrier invoice timing
Carrier rates vary by shipping zone (distance between warehouse and destination), and the distribution of zones shifts as a brand acquires customers in new geographies. A brand that historically shipped 60% of orders to Zones 2-4 (close to the warehouse) may find that a successful national ad campaign pushed 35% of new orders into Zones 6-8, where shipping costs per package can be 40-70% higher.
On top of zone pricing, eCommerce shipping surcharges accumulate: peak season surcharges (Q4), fuel surcharges (adjusted monthly), residential delivery fees, address correction charges, and oversized package penalties. Shopify merchant data shows that merchants spend an average of 8.7% of yearly expenses on shipping alone, and that figure understates the true cost for brands with heavy, bulky, or geographically dispersed shipments.
Watch for this signal: Carrier invoices typically arrive 2-4 weeks after the shipping month closes. Surcharges, adjustments, and corrections are applied retroactively. This means the margin your operations dashboard shows during the month is structurally optimistic. The real shipping cost per order only becomes visible at reconciliation, which is why margin variance during month-end close so often traces back to shipping.
The free shipping fallacy
Free shipping thresholds set too low subsidize unprofitable orders. A brand offering free shipping at $50 with an average shipping cost of $9.50 per package earns slim or negative contribution margin on every order between $50 and roughly $65, depending on product mix. Those orders look like revenue on the dashboard. They look like margin leaks on the reconciled P&L.
One of our clients ran the analysis and discovered that raising their free shipping threshold from $100 to $150, validated by A/B testing with minimal conversion impact, generated $1.5M in annualized savings. A separate carrier optimization effort based on the same fulfillment cost variance data reduced fulfillment costs by 30%.
Leak #3: The Channel Fee Trap
Selling across multiple channels is a growth strategy. It is also a margin fragmentation strategy. The same SKU sold through Shopify, Amazon, TikTok Shop, and a wholesale partner generates four different margin profiles because each channel imposes its own fee structure.
Marketplace versus DTC margin disparities
Amazon charges referral fees (typically 8-15% depending on category), FBA fees (pick, pack, ship, and storage), and various program fees. TikTok Shop takes a commission on each sale plus payment processing. Shopify's costs are primarily payment processing (2.4-2.9% plus per-transaction fees) and any app or fulfillment costs the brand opts into. A $60 product that generates $28 in contribution margin on Shopify DTC might generate $14 on Amazon FBA after referral, fulfillment, and storage fees. That is a 50% margin difference on identical revenue, and it only surfaces when you measure SKU-level profitability by channel rather than blending all channels into one number.
The payment gateway haircut
Payment processing fees vary by provider and payment method. Shopify Payments charges 2.4-2.9% plus $0.30 per transaction. PayPal takes 2.9% plus $0.30. Klarna and Afterpay (buy now, pay later) can reach 3.5-5.5% because the platform assumes the credit risk. When a brand runs a BNPL promotion and the payment mix shifts, processing fees can jump by a full percentage point across thousands of orders. On $2M in monthly revenue, that is $20,000 in unforecasted cost that sits between gross revenue and actual margin.
Platform settlement timing adds another layer of opacity. Amazon settles every two weeks. Shopify processes payouts daily or weekly. TikTok Shop has its own settlement cadence. Each platform's settlement cycle creates a window where the cash in the bank does not match the revenue on the dashboard, and the fees embedded in each settlement are not always line-item transparent.
Why Blended Averages Hide the Leaks
The most dangerous habit in eCommerce finance is treating returns, shipping, and channel fees as blended percentages on the P&L. "Returns: 5.2% of revenue." "Shipping: 11.8%." "Platform fees: 6.4%." These aggregates create the illusion of stability while masking dramatic SKU-level and channel-level variation underneath.
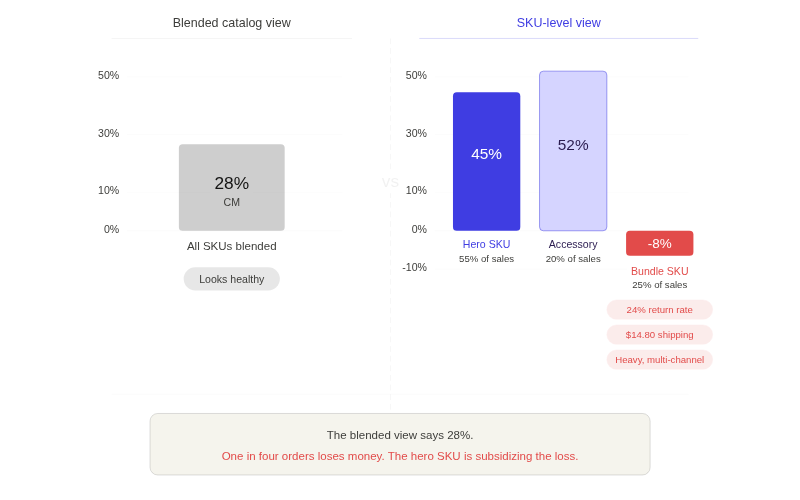
Important: A blended catalog margin of 28% can contain a hero SKU earning 45% contribution margin and a bundle SKU losing 8% on every order. The hero subsidizes the bundle. The P&L shows 28%, and the operator scales ad spend on both products equally, pouring fuel into a product that destroys margin on every sale.
Here is what that cross-subsidy looks like in practice:
The blended view says 28%. The reality is that 25% of sales volume actively destroys margin. The true cost-to-serve per SKU/channel is the only metric that makes this visible. Without it, the operator keeps spending to scale the bundle, keeps subsidizing its free shipping, and keeps wondering why cash flow does not match the margin dashboard.
Plugging the Leaks with Saras Pulse
Saras Pulse connects Shopify, Amazon, 3PLs, ERPs, and carrier systems into a unified cost model that calculates fully burdened contribution margin at the SKU and order level, daily. Instead of waiting for month-end to reconcile shipping cost reconciliation by SKU/channel, finance teams see the actual margin as costs land.
Jason Panzer, President of HexClad: "We go to Saras Pulse and get our daily contribution margin reporting. We get all of our marketing metrics by channel, by category, even down to the SKU. Everything is pulled in automatically."
💡 Stop Inventory Margin Leaks: BPN used this visibility to catch inventory overstock patterns early, saving $500K annually in write-offs that previously went undetected until quarterly reviews.
Conclusion
eCommerce margin leakage is not an inevitable cost of scaling. It is a visibility problem. Returns, shipping, and channel fees leak margin at the order level, and they only become visible when profitability is measured at the order level. Aggregate P&L views, monthly reconciliation cycles, and blended cost averages all structurally hide these leaks until they have already compounded across thousands of orders.
Get the contribution margin intelligence platform that tracks every variable cost at the SKU level and catches margin erosion before it reaches the month-end close. Talk to our data consultants about plugging your margin leaks.

.png)
.svg)
%201%20(1).svg)


.png)


.png)


.png)


.png)


.png)


.png)


.webp)


.avif)


.avif)

.avif)
.avif)
.avif)
.avif)
%20(1).avif)
.avif)
%20(1).avif)
%20(1).avif)


