


Fragmented data, disconnected reports, and hours spent on spreadsheets: that’s the daily reality for many eCommerce brands trying to keep up with performance metrics. It becomes even more complicated when they have to juggle multiple platforms like Shopify, Amazon, Meta Ads, and GA4. Without a unified eCommerce analytics dashboard, leadership often doesn’t get complete visibility into the numbers.
According to PwC, 73% of customers say their purchasing decisions are directly influenced by their experience. But delivering a consistent experience across all touchpoints is impossible when marketing, sales, and operations aren’t leveraging the same data. That’s where eCommerce analytics dashboards come in. These powerful, visual command centers provide instant insights and enable smarter decisions.
But with so many options available, choosing the right eCommerce analytics dashboard can seem like a challenge. In this blog, we’ll walk through what makes a great analytics dashboard for eCommerce, what metrics you should track, how to choose the right tool, and a detailed comparison of the top 10 dashboards in 2026.
What is an eCommerce Analytics Dashboard?
Simply put, an eCommerce analytics dashboard is a centralized reporting hub that visually displays your business’s most important performance metrics. These dashboards pull and unify data from multiple sources, such as Shopify, Amazon Seller Central, Meta Ads, Klaviyo, Google Analytics 4 (GA4), CRMs like HubSpot, and inventory management tools. They give you a real-time view of your operations, marketing, customer behavior, and financials.
Dashboards are typically built using business intelligence platforms or pre-built analytics tools that allow teams to slice, filter, and explore their data without relying on engineering support every time.
Is your data actually Decision-Grade?
9 questions. 3 minutes. Score your Profitability Visibility and Readiness for AI-driven growth.
Start Free Diagnostic
Why eCommerce Analytics Dashboards Matter
As your eCommerce business grows, the number of decisions you need to make daily multiplies. Which campaigns are driving the highest LTV? What’s causing margin erosion? Where are your top customers dropping off? Choosing the right analytics eCommerce dashboard ensures you don’t have to guess the answers.
1. Data-Driven Decision Making
To act with confidence, the leadership teams must have real-time access to unified data. With an eCommerce dashboard analytics setup, brands can move from lagging, spreadsheet-based reporting to proactive, data-backed decision-making. According to McKinsey, data-driven organizations are 23 times more likely to acquire customers and 19 times more likely to be profitable.
2. Enhanced Operational Efficiency
Operational bottlenecks like late shipments, stockouts, or high return rates can seriously impact customer satisfaction. But when you have dashboards that show real-time order status, fulfillment times, and inventory turnover, you can identify and fix issues faster.
3. Customer Experience Improvement
Bad customer experience is often the reason behind high cart abandonment rates, low repeat purchase behavior, and poor NPS scores. That’s why you need dashboards that can help your teams monitor behavior across the funnel. It becomes easier to highlight where customer friction is highest.
4. Marketing Campaign Optimization
To optimize your marketing campaigns, you need answers to some crucial questions, like:
- Which paid channels are driving the best ROAS?
- How much are you spending to acquire a customer?
- What’s your CAC payback period?
An eCommerce analytics dashboard lets you track channel performance, AOV, and campaign attribution in one place. This way, you can optimize your marketing spend in real time.
5. Financial Performance Monitoring
Factors like gross margins, refund rate, and customer LTV determine your profitability. When you have an eCommerce analytics dashboard that helps you with these numbers, it gets easier for your finance team to keep track of trends like revenue by channel, discount impact, and margin contribution, enabling better planning and forecasting.
Must-Have Metrics and KPIs in an eCommerce Analytics Dashboard
Before investing in any analytics tool, it’s critical to ensure it captures the right ecommerce KPIs across your funnel. A well-structured analytics eCommerce dashboard will include the following:
Tracking these KPIs helps you benchmark CAC-to-LTV ratios, optimize acquisition channels, and plan retention strategies.
Types of eCommerce Analytics Dashboards
It’s true that not all dashboards serve the same purpose. Depending on the team and objective, the design and content of your eCommerce analytics dashboard will vary. So, here is a breakdown of the main types used by growing eCommerce brands:
1. Marketing Dashboard
Using this dashboard, you can keep an eye on ad performance, channel attribution, campaign ROAS, cost per click (CPC), and CAC. It’s great for marketing teams optimizing budgets across Meta, Google, TikTok, and email.
For example, in Saras Pulse, a multi-channel ROAS tracker highlights underperforming ad sets and high-performing campaigns with segment-level breakdowns.

2. Sales Performance Dashboard
This kind of dashboard allows you to track sales by product, geography, channel, and time period. It can help your revenue teams understand what's driving growth and where drop-offs are happening.
Tip: Filter by promotion period vs. regular period to see real lift.
3. Customer Insights Dashboard
A customer insights dashboard segments your customer base by cohort, retention behavior, LTV, and purchase frequency. Now, this is vital for CRM and growth teams focused on retention and loyalty programs.
4. Operations & Fulfillment Dashboard
The purpose of this dashboard is to cover delivery times, inventory levels, stockouts, and returns, which becomes essential for operations teams to identify fulfillment lags and warehousing issues.
5. Executive Dashboard
Lastly, an executive dashboard is meant for providing a top-line summary across departments, i.e., sales, marketing, customer, and operations, thus making it ideal for weekly leadership syncs. Here, Saras Pulse offers execs an eagle-eye view with drill-down capability into any metric.
Challenges with eCommerce Analytics Dashboards
While eCommerce analytics dashboards are powerful, implementing them isn’t always straightforward. Brands often face hidden hurdles that block visibility, create reporting delays, and introduce costly inefficiencies. Before investing in any tool, it’s crucial to understand the challenges and how to overcome them.
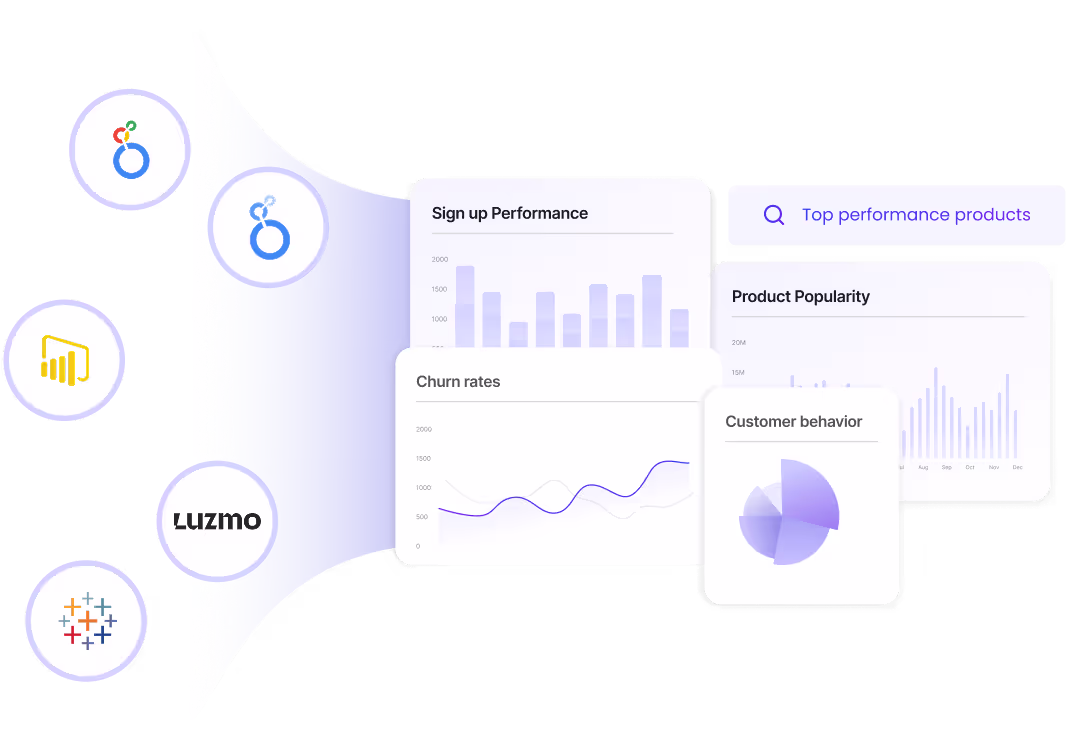
Data Integration
Modern eCommerce businesses rely on a diverse set of tools, such as Shopify for storefronts, GA4 for web analytics, Meta Ads and Google Ads for marketing, Amazon for marketplaces, and CRMs like Klaviyo or HubSpot. Each of these platforms speaks a different language.
Without a strong integration layer, data stays siloed. This fragmentation makes it nearly impossible to build a unified view across your eCommerce dashboard analytics setup.
Pro Tip: Saras Daton, the ELT engine powering Saras Pulse, supports 200+ native connectors and 5,000+ APIs. It automates data collection from Shopify, Amazon, Meta Ads, Klaviyo, and more. This ensures a seamless data pipeline into your dashboard.
Data Accuracy
Inaccurate data is worse than no data. Common issues include:
- Duplicate transactions
- Misattributed conversions
- Lag between event capture and report update
- Revenue mismatches between Shopify and GA4
For example, if your analytics eCommerce dashboard shows ROAS based on a lagged Meta Ads report, but Shopify has real-time sales, your marketing insights could be completely off-line. Fortunately, Saras Pulse includes automated data validation, so your metrics are trustworthy.
Data Security
eCommerce dashboards often handle sensitive customer information like email, phone numbers, and purchase history. Improper access controls, especially when using spreadsheets or third-party plugins, can result in compliance risks.
That’s why you should opt for tools that are SOC 2 compliant and offer user-level permissions, audit logs, and data masking options to keep your customer data secure and compliant. Sara Pulse is one of them.
Manual Data Cleaning
Even with integrations in place, messy data structures often require teams to spend hours cleaning and deduplicating CSV exports. Version control issues further compound the problem, especially when multiple stakeholders edit files in silos.
Saras Pulse solves this by using pre-built, scalable data models for eCommerce brands. These models automate cleaning, normalization, and mapping, thus making your dashboard always analysis-ready.
Limited Drill-Down and Segmentation
Many pre-built dashboards restrict custom views. For instance, you might be able to see revenue by campaign but not by product, geography, or cohort. Without granular drill-down, root-cause analysis becomes guesswork. Here, Saras Pulse offers fully customizable dashboards and segment-level filters. This makes it easier for teams to go from macro to micro in a few clicks.
%20(1)%20(1).png)
Build vs Buy: What’s Better for Your eCommerce Analytics Dashboard?
Some eCommerce teams consider building their own dashboard with tools like Looker, Power BI, or Tableau, while others prefer ready-to-use solutions. But how do they compare? Here’s a breakdown:
While building gives you full control, it also requires hiring data engineers, managing infrastructure, and continuously updating connectors. For most eCommerce brands, especially mid-market and growth-stage companies, buying a robust solution like Saras Pulse is both time- and cost-efficient.
Top 10 Ecommerce Analytics Dashboards to Use in 2026
When it comes to making data-driven decisions, choosing the right dashboard becomes crucial for any eCommerce brand. We have evaluated some of the best eCommerce analytics tools based on their eCommerce focus, integration capabilities, user experience, and overall value for growing brands.
Here’s a comparison table to give you a clearer picture:
10 Best Ecommerce Analytics Dashboard in 2026
Saras Pulse: Best for unified, real-time analytics for scaling eCommerce brands.
Glew.io: Best for product and customer insights for small to mid-size online stores.
Polar Analytics: Best for fast, plug-and-play dashboards tailored to DTC brands.
Daasity: Best for omnichannel eCommerce teams needing ETL and analytics in one.
Triple Whale: Best for Shopify-focused brands tracking attribution on the go.
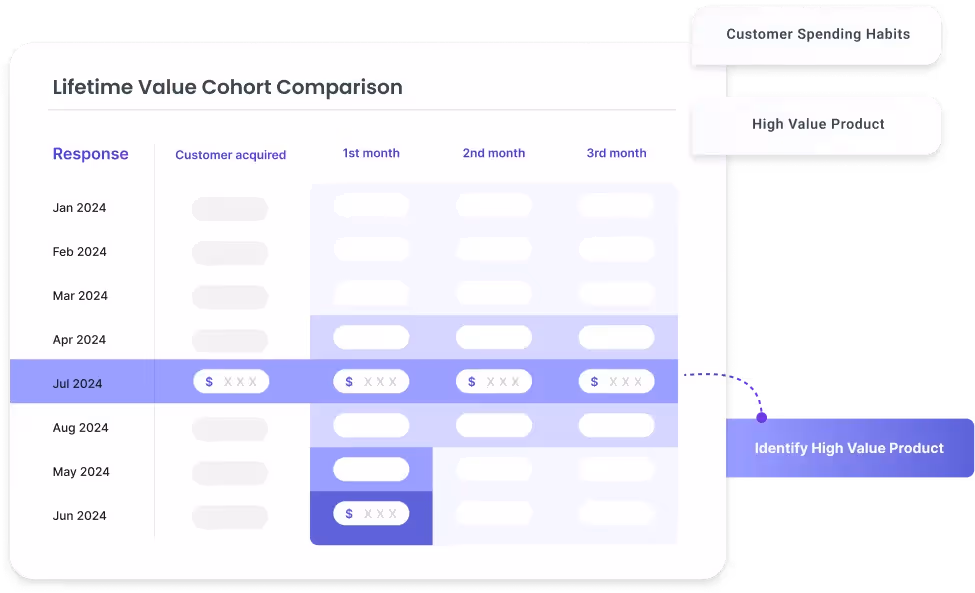
Lifetimely: Best for LTV projections and cohort analysis for Shopify sellers.
Google Analytics: Best for traffic, behavior, and web performance tracking.
Databox: Best for customizable dashboards across marketing and sales tools.
Adobe Analytics: Best for deep enterprise-level segmentation and analysis.
Mixpanel: Best for tracking product usage and user behavior across devices.
1. Saras Pulse
Saras Pulse is a comprehensive eCommerce analytics dashboard platform built specifically for omnichannel brands, enterprise retailers, and data-forward DTC companies. Designed for high-scale operations, Saras Pulse offers real-time, fully customizable dashboards that unify marketing, sales, operations, and customer data in one place.
Its backbone, Saras Daton, is an enterprise-grade ELT engine that supports over 200 connectors and 5,000+ APIs. Now, this really helps in ensuring seamless data integration from platforms like Shopify, Amazon, Meta Ads, Klaviyo, GA4, and more.
Unlike generic BI tools or lightweight analytics solutions, Saras Pulse is built to go deep, thereby supporting multi-channel attribution models, cohort retention views, SKU-level profitability insights, and even CAC payback calculations. It’s trusted by mid-market and enterprise eCommerce companies like AG1, Faherty, True Classic, and Hexclad. With Pulse you get accurate, granular, and secure insights without depending on engineering support for every new request.
Pros
- Purpose-built KPIs and pre-modeled metrics for eCommerce
- Real-time dashboards with advanced filtering (by SKU, geo, channel, cohort, etc.)
- Deep integrations via Saras Daton eliminate siloed data
- SOC 2-compliant with user access control and data masking
- Built-in scalability—support for multi-storefront, international markets, and retail-POS data
Cons
- May be too advanced for early-stage brands with minimal data complexity
- Mobile dashboard experience currently under beta testing
Pricing
Starts at $300/month for the Growth plan; pricing scales based on data volume, features, and support needs. Custom enterprise packages are available for larger brands with advanced requirements.
Customer Ratings
4.8/5 on G2 (as of May 2026)
.avif)
2. Glew.io
Glew.io is a plug-and-play eCommerce analytics dashboard made for small to mid-sized DTC brands. It offers templated reporting across sales, product performance, customer segmentation, and channel attribution. Glew is especially popular among Shopify users due to its simple setup and accessible UI.
Its primary strength lies in helping smaller teams get up and running quickly without needing technical skills. While it lacks advanced customization and modeling capabilities, it’s a solid choice for brands that want basic visibility into product performance, top customers, and sales trends without complexity.
Pros
- Quick onboarding for Shopify, WooCommerce, and Amazon
- Affordable for bootstrapped teams
- Includes customer segmentation and product margin reporting
Cons
- Reports are not easily customizable beyond standard views
- Slower to refresh with large data sets
- Not ideal for multi-channel or high-SKU catalogs
Pricing
Starts at $79/month for <$1M revenue; $249 for $1M–$5M, $499 for $5M–$10M, and $649 for $10M–$15M.
Customer Ratings
4.3/5 on G2 – users appreciate the value-for-money and fast setup but note limitations in scaling and flexibility.
3. Polar Analytics
Polar Analytics is a self-serve BI tool purpose-built for Shopify-centric DTC brands. It specializes in visualizing acquisition, retention, and revenue data through clean, easy-to-understand dashboards. Its biggest strength lies in speed. Most users are fully operational within a day mainly due to its native connectors and preset templates.
It pulls data from Shopify, Amazon, Facebook Ads, Google Ads, and Klaviyo, giving marketers an end-to-end view of performance. While powerful for early-stage and growth brands, it has limited support for brands expanding into marketplaces, retail POS, or Amazon. However, Shopify POS orders are supported via Shopify.
Pros
- Great for startups and DTC marketers
- Anomaly detection and alerts built-in
- Beautiful and intuitive UI
Cons
- Less robust for operational or financial metrics
- Limited customization of metrics beyond default templates
Pricing
Analyze plan starts at $300/month, Analyze & Enrich at $450/month, and Enterprise is custom.
Customer Ratings
4.6/5 on G2 – loved for its clean UX and quick insights.
4. Daasity
Daasity offers a hybrid platform combining ELT capabilities with customizable dashboards tailored for scaling omnichannel brands. It integrates with Shopify, Amazon, retail POS systems, and paid media platforms to create a 360° business view. Daasity is best suited for brands that are ready to build a more mature analytics ecosystem with engineering involvement.
It offers SQL-based customization for data teams, cohort models, and prebuilt dashboards for finance, marketing, and operations. However, it does have a steeper learning curve and is more expensive than most plug-and-play tools.
Pros
- Deep data modeling capabilities
- Works across eCommerce, retail, and wholesale channels
- Supports advanced segmentation and finance metrics
Cons
- Requires technical involvement for setup and updates
- Longer implementation cycle compared to competitors
Pricing
Shopify App Store lists entry at $399/month, but this may be for smaller brands; full-featured and omnichannel plans are typically custom and can be much higher.
Customer Ratings
4.5/5 on G2 – praised by data teams but considered less ideal for non-technical marketers.
5. Triple Whale
Triple Whale is a mobile-first marketing analytics dashboard popular among Shopify merchants. The areas where it shines are attribution tracking, ad spend analysis, and visual storytelling. It’s ideal for marketers looking for real-time feedback on performance across Meta, Google, and email.
Its mobile app is a highlight, allowing users to check ROAS, spend, and conversion data on the go. However, Triple Whale is primarily designed for ad performance. It provides product- and SKU-level analytics, attribution, and performance insights, especially for DTC brands on Shopify.
Pros
- Real-time attribution dashboard
- Mobile-first experience
- Excellent Shopify + Meta Ads integration
Cons
- SKU-level performance is available, though advanced profitability analytics may be limited on some plans.
- Doesn’t support complex segmentation or cohort modeling
Pricing
Growth plan starts at $129/month, Pro starts at $199/month, and Enterprise starts at $279/month.
Customer Ratings
4.4/5 on G2 – highly rated for user experience and campaign visibility.
Related Read: Triple Whale Alternatives - Saras Pulse vs Triple Whale
6. Lifetimely
Lifetimely focuses on profitability and retention metrics, especially customer lifetime value (LTV), repeat purchase behavior, and cohort analysis. The dashboard you get with Lifetimely is minimalistic and highly focused on finance-driven growth decisions.
If you're looking to break down LTV by acquisition source or understand payback periods by campaign, Lifetimely delivers quick value. However, it doesn't support broader sales, operations, or marketing metrics. So, it is not a full replacement for broader dashboard tools.
Pros
- LTV, cohort, and payback-focused dashboards
- Clean UI and helpful financial modeling tools
- Ideal for early- to mid-stage brands
Cons
- Doesn’t support marketplace or retail integrations
- No operations or marketing dashboards
Pricing
Free for up to 50 orders/month; M plan at $149, L at $299, XL at $499, XXL at $749, Unlimited at $999/month.
Customer Ratings
4.5/5 on G2 – users call it “game-changing” for understanding LTV trends.
Related Read: Lifetimely Alternatives - Saras Pulse vs Lifetimely
7. Google Analytics (GA4)
GA4 is Google’s latest web and app analytics solution, offering strong event tracking and behavior flow insights. While GA4 is not an eCommerce dashboard analytics tool out of the box, it can be customized with eCommerce event tagging to support funnel and purchase metrics.
Most teams use GA4 alongside other tools for tracking site behavior, landing page performance, and UTM-driven campaigns. However, it lacks financial modeling, order-level drill downs, or attribution accuracy, particularly when it comes to measuring post-click metrics.
Pros
- Free and widely supported
- Strong session and path analysis
- Seamless with Google Ads
Cons
- Steep learning curve
- Doesn’t support revenue modeling or margin data
- Attribution models are limited
Pricing
Free for standard GA4; GA4 360 (enterprise) starts at $50,000/year.
Customer Ratings
4.2/5 on G2 – praised for traffic data but often called unintuitive.
8. Databox
Databox is a flexible dashboard tool that connects with dozens of platforms to create visual reports. It’s especially popular with agencies managing multiple clients and internal marketing teams that want to build high-level KPI boards.
Databox supports basic cohort and retention analytics but is less specialized than dedicated eCommerce analytics platforms. It’s a better fit for teams wanting presentation-style dashboards than deep operational analytics.
Pros
- Simple UI and drag-and-drop editor
- Integrates with 100+ tools
- Mobile reporting available
Cons
- No prebuilt eCommerce models
- Can’t handle complex calculations without workarounds
Pricing
Free for up to 3 data sources; Starter at $47/month, Professional at $159/month, Growth at $319/month, Premium at $799/month.
Customer Ratings
4.4/5 on G2 – highly rated for client dashboards but less so for internal use cases.
9. Adobe Analytics
Adobe Analytics is a high-end enterprise analytics platform used by global eCommerce players with massive traffic and cross-platform needs. It offers unparalleled segmentation and attribution depth but requires a dedicated team to manage and maintain.
If your team needs to analyze user behavior across web, mobile, POS, and customer support in one ecosystem, this could be a fit. That said, it’s costly and too complex for most mid-market players.
Pros
- Industry-leading segmentation and pathing
- Real-time data stream support
- Integrates with Adobe Experience Cloud
Cons
- Expensive and complex
- Setup and maintenance require trained specialists
Pricing
Pricing is not public, but industry estimates start at ~$48,000/year ($4,000/month) and can go much higher.
Customer Ratings
4.1/5 on G2 – powerful but noted as overwhelming for smaller teams.
10. Mixpanel
Mixpanel is best known in the SaaS world but is increasingly being adopted by eCommerce brands that want to track user journey behavior, funnel drop-offs, and feature adoption on web or mobile. It’s ideal for brands with apps or membership-based models.
It’s not a financial or marketing analytics tool, but it’s very effective for tracking engagement and retention in digital products.
Pros
- Funnel analysis, retention curves, and user paths
- Real-time event tracking
- Great for A/B testing behavior
Cons
- Not designed for transactional metrics
- Requires technical implementation
Pricing
Free for up to 20M events/month, Growth starts at $20/month, Enterprise at $1,667/month.
Customer Ratings
4.5/5 on G2 – loved by growth and product teams.
How to Choose the Right eCommerce Analytics Dashboard
When looking for an eCommerce analytics dashboard, it isn’t just about finding the tool with the most features. Rather, it’s more about aligning the tool with your business’s needs, maturity, and growth goals. Here’s a strategic framework to help you select the most suitable eCommerce analytics dashboard for your business.
1. Define Your Goals
Firstly, start by clarifying what your team is trying to achieve. Do you need to improve retention, optimize your ad spend, or understand profitability by SKU? A good analytics eCommerce dashboard should provide answers to your most pressing questions without requiring multiple exports or manual work.
2. Determine Key Metrics
Not every tool supports the same eCommerce KPIs. So, make a shortlist of metrics your leadership tracks regularly, such as ROAS, LTV, CAC payback, return rate, or inventory turnover. Next, ensure that the platform supports them natively (or even allows customization). For example, tools like Saras Pulse come preloaded with metrics tailored for eCommerce, from first-touch attribution to net margin by channel.
3. Platform Compatibility
You must check if the tool integrates easily with your existing stack, such as Shopify, Amazon Seller Central, Klaviyo, Meta Ads, GA4, and your ERP or CRM. It has always been seen that integration failures are one of the most common reasons teams abandon dashboards. A great eCommerce dashboard analytics tool will not only connect but also normalize the data automatically.
4. Cost vs. Value
When you start comparing different eCommerce analytics dashboards, don't just look at the subscription costs. You should also factor in the engineering time, manual reporting hours saved, and speed of decision-making. A tool that costs $1,000/month but replaces a full-time analyst and reduces decision delays can pay for itself in weeks.
5. Support and Scalability
No doubt, great support is non-negotiable. Whether it’s implementation support, fixing attribution errors, or customizing a dashboard, fast and priority support makes a difference. Also, consider how the platform will scale with your business across new geographies, sales channels, or storefronts.
%20(1).avif)
Why Growing Ecommerce Brands Choose Saras for eCommerce Analytics Dashboards
What makes Saras Pulse truly stand out is its combination of eCommerce depth and unmatched accuracy. Built specifically for omnichannel brands, it connects data from over 200 platforms, including Shopify, Amazon, Meta Ads, Klaviyo, and GA4.
Eventually, the platform transforms the data into actionable dashboards using pre-modeled eCommerce KPIs. Unlike traditional BI tools that require ongoing engineering support, Saras Pulse is fully self-serve with customizable drilldowns, cohort views, and campaign-level insights built right in.
With Saras Pulse, your marketing team can understand ROAS by SKU, your operations team can track fulfillment bottlenecks in real time, and your finance team can analyze margins and CAC payback instantly.
For growing brands in the U.S. juggling multiple tools and dealing with data silos, Saras Pulse is more than a dashboard, it's your single source of truth. If you find Daasity restrictive, consider a Daasity alternative like Saras pulse.
If you're ready to eliminate reporting chaos and make smarter, faster decisions with your data, talk to our data consultants today.

.svg)
.png)
%201%20(1).svg)


.png)


.png)


.png)


.png)


.png)


.png)


.webp)


.avif)


.avif)

.avif)
.avif)
.avif)
.avif)


