


.png)
Contribution Margin is commonly defined as a profitability metric.
For CFOs, FP&A leaders, and finance teams in growing eCommerce businesses, it is something more precise:
Contribution Margin is the most reliable way to understand where profit is created, constrained, or lost as operational complexity increases.
This article explains what contribution margin is, why it becomes harder to derive as businesses scale, and how finance teams actually use it to make pricing, growth, operational, and manpower decisions.
Is your data actually Decision-Grade?
9 questions. 3 minutes. Score your Profitability Visibility and Readiness for AI-driven growth.
Start Free Diagnostic
Contribution Margin: The Definition (and Why It’s Not Enough on Its Own)
At its simplest, contribution margin measures how much revenue remains after variable costs are deducted.
Formula
Contribution Margin = Revenue – Variable Costs
Variable costs typically include:
- Cost of goods sold (COGS)
- Discounts and refunds
- Shipping and fulfillment
- Platform and payment fees
- Marketing costs (when evaluating growth efficiency)
The contribution margin represents the portion of revenue available to:
- cover fixed costs
- fund growth
- generate profit
This definition is accurate, but incomplete for scaled businesses. Here’s how.
Why Contribution Margin Becomes Critical as Businesses Grow
In early-stage businesses, finance teams can rely on averages. As revenue grows, averages stop holding.
As an eCommerce business crosses $10M–$20M in annual revenue, several things change simultaneously:
- SKU count increases
- Promotions and bundles become frequent
- Fulfillment shifts to one or more 3PLs
- Shipping costs vary by zone, weight, and destination
- Multiple sales channels introduce different fee structures
At this point, finance leaders stop asking “Are we profitable?” and start asking:
- Which products actually support growth?
- Which offers look good in aggregate but fail at order level?
- Where are margins eroding despite revenue growth?
- What decisions are no longer safe to scale?
Contribution margin becomes the primary lens for answering these questions.
Why Contribution Margin Gets Harder as the Business Scales
<$5M Revenue
- Few SKUs
- One fulfillment path
- Minimal regional variation
- CM can survive on rough assumptions
$10–20M Revenue
- SKU proliferation
- Promotions and bundles
- Early 3PL usage
- Channel mix (Shopify, Amazon)
Contribution margin now requires SKU- and channel-level visibility.
$30–50M+ Revenue
- Multiple 3PLs
- Zone-based shipping
- International expansion
- Retail + DTC overlap
At this stage, blanket assumptions actively mislead decisions.
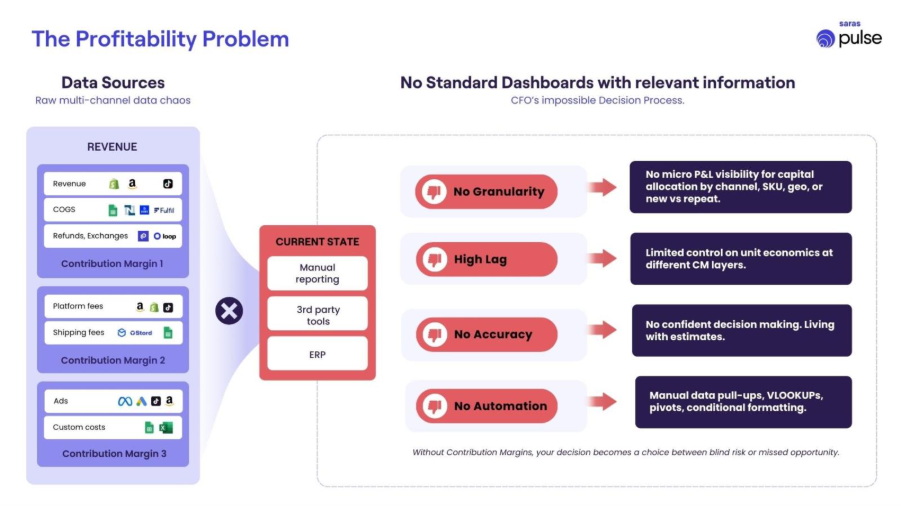
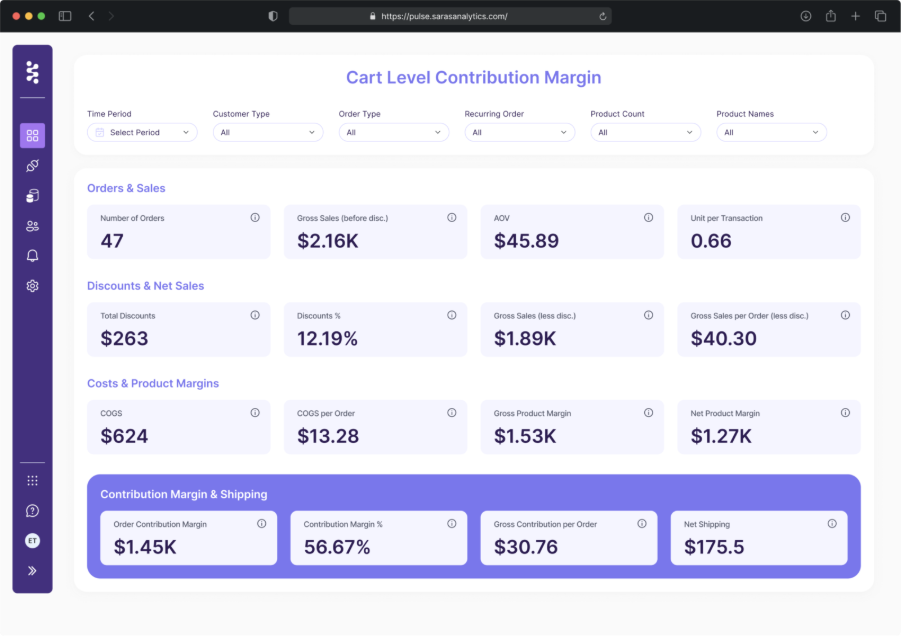
How CFOs Structure Contribution Margin: CM1, CM2, CM3
To manage increasing complexity, finance teams use layered contribution margins instead of a single number.
CM1 — Product Economics
Typically includes:
- Net revenue
- Landed COGS
- Discounts and refunds
What it answers:
Is the product fundamentally viable?
If CM1 is weak, downstream optimization does not fix the business.
CM2 — Operational & Fulfillment Economics
Includes:
- CM1
- Shipping and fulfillment
- 3PL fees
- Platform and payment fees
What it answers:
Are logistics, fulfillment, or channel mechanics eroding margin?
This is where many businesses discover hidden profit leakage.
CM3 — Growth Economics
Includes:
- CM2
- Paid marketing and acquisition costs
What it answers:
Is growth creating future profit or consuming it?
CFOs may tolerate lower CM3 temporarily, but only if CM1 and CM2 are trusted.
Where Contribution Margin Commonly Lies to You
- Blanket shipping assumptions
- Zero-dollar orders counted as customers
- Refund timing distortions
- Amazon deferred revenue mismatches
- Bundle economics hidden inside averages
- High-volume SKUs masking low-margin SKUs
And, this is because of the inherent nature of complexity involved in computing contribution margin at a high frequency, accurately.
The Complexity Behind Contribution Margin
While the formula is simple, deriving accurate contribution margin is operationally complex.
Why variable costs are not truly “variable” at scale
Costs vary by:
- SKU size and weight
- Fulfillment center and 3PL
- Shipping zone and destination
- Returns behavior
- Bundle composition
- Promotion structure
Two orders with identical revenue can have very different contribution margins.
This is why contribution margin is not a static calculation, it is a living financial model that must evolve as business rules change.
How CM Matures with Business Complexity
This is another missing core element.
Explain progressive CM maturity, not all-or-nothing.
Typical evolution:
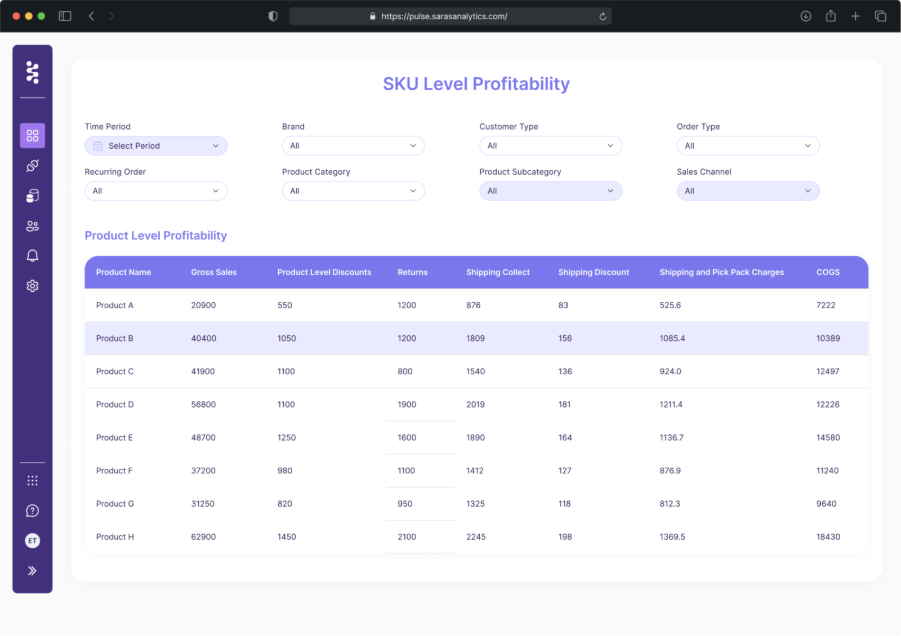
- Channel-level CM (early stage)
- SKU-level CM (growth stage)
- Offer & bundle CM (scale stage)
- Cohort-based CM (optimization stage)
- Order-level CM (control stage)
If you jump to order-level CM before cleaning product and cost masters, you create noise , not insight.
The 3PL Angle: Where Contribution Margin Often Breaks
3PL costs are one of the most common sources of CM distortion. Typical oversimplifications include:
- Averaging shipping costs across all orders
- Ignoring dimensional weight changes by SKU
- Treating returns as uniform
- Blending storage and fulfillment fees
In reality, 3PL economics depend on:
- warehouse location
- zone-based pricing
- pick-pack complexity
- packaging requirements
- returns handling
When 3PL costs are averaged instead of attributed:
- High-volume SKUs hide low-margin SKUs
- Certain regions appear profitable when they are not
- Promotions look successful until cash tightens
This is often when finance teams lose confidence in margin reporting.
How the Need for Contribution Margin Changes with Scale
The role of contribution margin evolves as the business grows.
At scale, contribution margin becomes a constraint system:
- What should not scale further?
- Where should capital stop flowing?
- Which assumptions are no longer valid?
At this stage, CM is less about growth and more about protecting profitability.
What Happens in the Absence of Reliable Contribution Margin
When contribution margin is missing, delayed, or distrusted, businesses default to proxy decisions.
Common consequences include:
- Marketing spend increases without margin context
- Expansion decisions stall due to uncertainty
- Inventory planning becomes overly conservative
- Profitability discussions become subjective
One critical downstream impact is often overlooked: manpower planning.
Contribution Margin and Manpower Planning
Headcount decisions are ultimately margin decisions.
Without reliable contribution margin:
- Hiring is driven by revenue optimism
- Cost pressure appears late
- Businesses are forced into reactive hiring freezes or layoffs
With reliable contribution margin:
- Teams scale only where margin supports volume
- Operations hiring aligns with profitable throughput
- Growth hiring aligns with efficient acquisition
Contribution margin helps CFOs answer:
How many people can this business afford today without relying on future growth assumptions?
Using Contribution Margin as Decision Infrastructure
In mature finance organizations, contribution margin is not just reported, it is used.
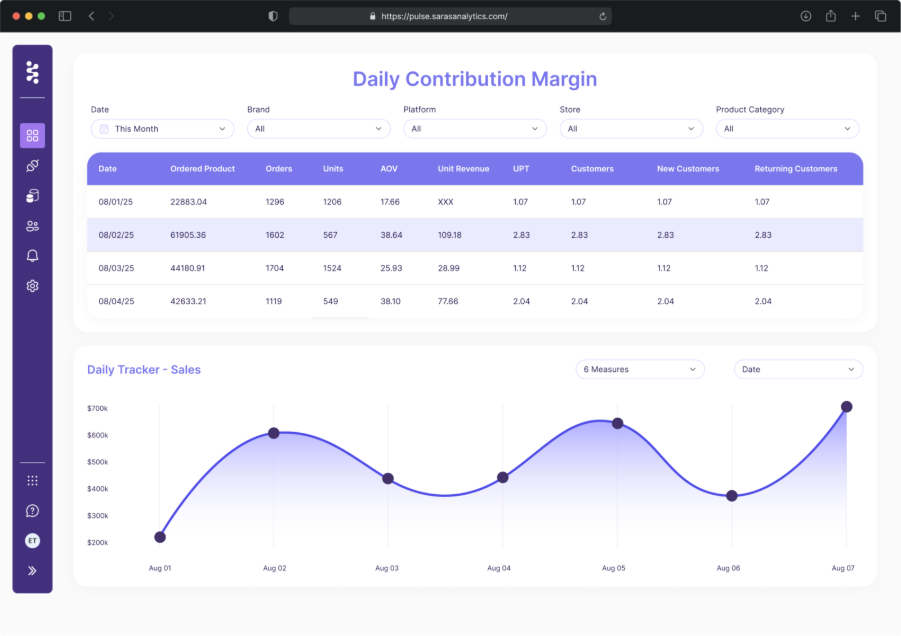
Typical usage patterns:
- Daily: detect anomalies and cost drift
- Weekly: guide spend and operational decisions
- Monthly: reconcile performance and validate assumptions
For contribution margin to remain trusted, finance teams must be able to:
- explain why CM changed
- trace it back to underlying drivers
- validate numbers when challenged
This is why many scaled teams rely on a strong data foundation, supported by platforms such as Saras Daton and Saras Pulse, to maintain order-level traceability while supporting daily decision-making.
Contribution margin is not just a profitability metric.
For CFOs and finance teams, it is the clearest signal of where a business can safely grow, where it must stop, and what it can afford, today.
If contribution margin does not change decisions as the business scales, it is not being used correctly. Talk to our Data Consultant to understand how to apply it effectively across your business.

.png)
.svg)
%201%20(1).svg)


.png)


.png)


.png)


.png)


.png)


.webp)


.avif)


.avif)

.avif)
.avif)
.avif)
.avif)
%20(1).avif)
.avif)
%20(1).avif)
%20(1).avif)


