


Revenue growth is often celebrated as the clearest signal of success. At first glance, a rising topline suggests scale, market demand, and operational execution. However, when profitability is assessed only through aggregated P&L lines, the full story remains hidden. Fulfillment costs, shipping subsidies, packaging expenses, and returns get buried in “operational” buckets, making high-margin growth look stronger than it is.
This blind spot is particularly acute in DTC health and wellness products. Be it compliance-driven unsellable returns or leak-prone packaging, this sector comes with structural cost challenges, ones that remain invisible without SKU-level profitability. That’s the gap between reporting profitability and actually sustaining it.
Is your data actually Decision-Grade?
9 questions. 3 minutes. Score your Profitability Visibility and Readiness for AI-driven growth.
Start Free Diagnostic
Understanding the Fundamentals of SKU-Level Profitability
True profitability pivots on the concept of contribution margin, not just gross margin. In essence:
- Gross margin = Revenue – COGS
- Contribution margin = Revenue – (COGS + Shipping + Pick-and-Pack + Packaging + Returns)
It’s only when we trace each of these costs back to the individual SKU that we isolate the business' true performers versus the margin drains.
Wellness Specifics: Why this matters more in the health and wellness category
Let’s say you’re selling both a single vitamin bottle and a 30-day bundle. The single bottle seems profitable from a gross margin standpoint. Yet each order, trial or bundle, triggers roughly the same pick-and-pack effort and shipping cost. The bundle may be more expensive to produce, but it spreads these fixed fulfillment costs across multiple units, often making it more profitable overall.
Without cost allocation for CFOs, this nuance is lost, and we risk scaling SKUs that actually erode margin.
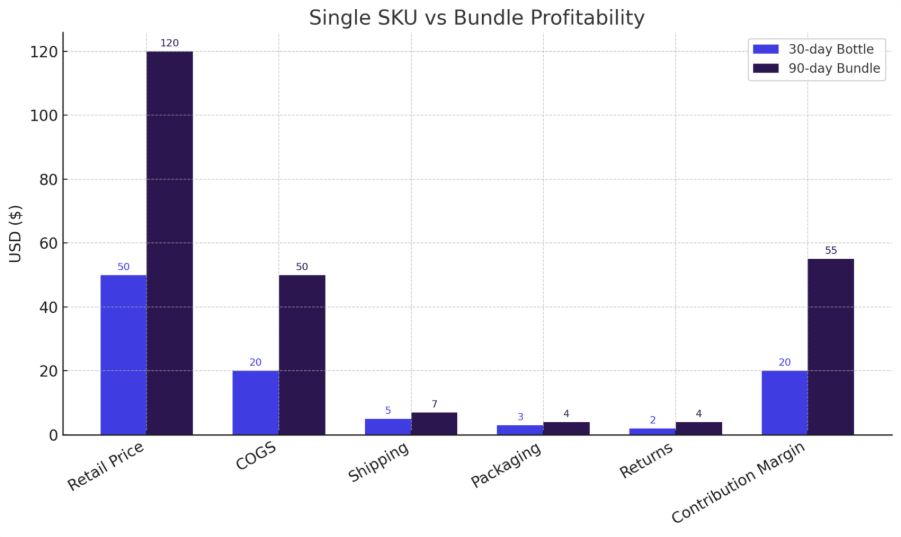
This chart compares a 30-day bottle and a 90-day bundle. While the single SKU looks profitable at gross margin, the bundle spreads fulfillment costs across more units, resulting in a much stronger contribution margin.
The Blind Spot in Financial Models: Why CFOs should consider analyzing SKUs
Finance models often rely on aggregated lines like “Ops” that obscure underlying cost structures. In these setups:
- Shipping and fulfillment are lumped together
- Returns are buried in G&A
- There’s no cohort or SKU-level drilling
Averages conceal outliers. For instance, a lightweight supplement capsule with excellent subscription behavior likely subsidizes a heavier, fragile liquid SKU that attracts higher fulfillment costs. Both appear equally profitable; but one is quietly draining working capital.
Contribution Margin Distortion: How untracked fulfillment costs skew profitability by SKU or cohort
Contribution margin is vital in wellness, where four factors regularly skew the numbers:
- Non-resellable returns: Supplements or creams returned for hygiene reasons must often be destroyed rather than restocked. This goes straight to cost.
- Expiry and storage risk: Consumables typically expire; slow-moving SKUs take up space and invite markdowns, even write-offs.
- Liquid weight and DIM weight charges: Freight costs balloon with fluid volume and dimensional pricing, even if the SKU looks small.
- Subscription cadence disparities: A “30-day trial” SKU might carry the same costs as the 90-day bundle, but with far worse unit economics.
While not SKU-specific, this shows how deeper financial visibility, especially by SKU or cohort, can revive margin performance rapidly.
The Other Dimension: Customer Cohorts
Cohort-level visibility, when paired with SKU contribution, gives clear strategic insight that aggregate P&L misses entirely.
For example:
- First-time buyers might order at a discount with free shipping and often generate a negative contribution after that is allocated.
- Repeat subscribers who bundle products loyal over time can flip to significantly positive contribution.

If you look at the chat above, you’ll notice that trial buyers often remain unprofitable for many months, while subscribers or bundle buyers cross into positive contribution much faster. As a result, allocating acquisition spend toward subscriber cohorts accelerates payback and builds more resilient, long-term profitability.
Data-Driven Solutions: Mapping hidden costs with data ingestion & cost segmentation
One of the reasons CFOs in the DTC health and wellness sector struggle with SKU-level profitability is the data itself. Costs flow in from different systems:
- ERP software manages COGS and batch costs.
- 3PL providers track fulfillment fees.
- Carriers issue invoices with surcharges and dimensional weight adjustments.
- Commerce platforms capture order-level detail.
- Marketing platforms report on acquisition costs by campaign or channel.
Each of these streams is siloed. Without integration, the numbers collapse back into aggregated expense lines, blurring the visibility CFOs need.
The case for ingestion and segmentation
By ingesting data across systems and applying cost allocation rules at the SKU level, CFOs can eliminate distortions. For example:
- Shipping expense can be allocated using actual weight and zone rather than spreading evenly across orders.
- Return processing costs can be tied to the specific SKUs with the highest return rates.
- Storage fees can be attributed to SKUs that move slowly and approach expiry, rather than divided flat across inventory.
Real wellness example: Greater Than
Greater Than, a wellness drinks brand, initially tracked bundle economics only at the order level. By unbundling SKU-level performance with integrated data ingestion, they exposed hidden inefficiencies inside the bundle. This clarity improved inventory accuracy by 30% and accelerated financial reporting by 20%. More importantly, it gave the CFO visibility to scale winning SKUs and trim underperformers. Click here to read the entire case study.
This is what true profitability analysis looks like. Without SKU- and cohort-level segmentation, CFOs are essentially steering blind.
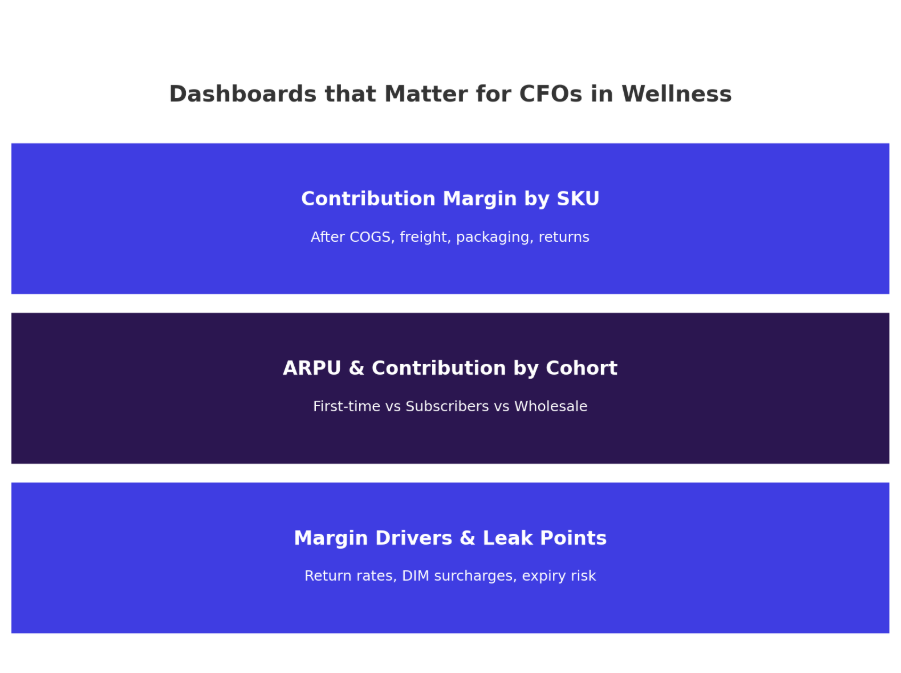
Dashboards that Matter: Executive views of SKU profitability, ARPU, and margin drivers
Even the cleanest allocation model is useless if insights remain locked in spreadsheets. CFOs need dashboards that act as operating tools, not static reports.
So, why does this matter? For wellness, each return is typically a total write-off. A dashboard that blurs this difference leaves CFOs with a false sense of profitability.
Here is an example:
BPN, a performance supplement brand, used integrated dashboards to reactivate churned subscribers. By combining SKU-level contribution with customer segmentation, they unlocked $900K in incremental revenue and reduced acquisition pressure. Click here to read the entire case study.
The right kind of dashboards help you create the right decisions:
- Should underperforming SKUs be redesigned, repriced, or retired?
- Should bundle incentives be introduced to shift mix toward profitable packs?
- Which cohorts deserve retention investment, and which should be allowed to churn?
Why CFOs Need SKU-Level Visibility
The role of the CFO in a DTC health and wellness business is no longer limited to reporting financial history. Investors, boards, and operating teams expect the finance function to shape strategy. That requires clarity; not just in aggregate, but down to the SKU and cohort level.
The danger of the “hero SKU” illusion
In many health and wellness companies, a single product is celebrated as the growth engine. On paper, its gross margin looks strong. In reality, hidden fulfillment costs and oversized returns may turn each unit into a loss. Without SKU-level visibility, these products continue to be promoted, eating into working capital while subsidized by healthier SKUs.
Cohort-level distortion
As we saw in the cohort section, blended P&L views mask trial vs subscriber differences, often sending marketing dollars to the wrong channels.
Related Read: Cohort Analysis
Strategic alignment
SKU-level visibility allows CFOs to answer boardroom-critical questions:
- Which SKUs create durable contribution, and which destroy it?
- Which cohorts deserve retention spend?
- How long does CAC actually take to repay, once all fulfillment costs are included?
- Where is working capital being tied up in unprofitable products?
With this clarity, CFOs shift from defensive margin management to offensive growth leadership.
How Saras Analytics Helps CFOs: Profitability insights powered by data ingestion + Dashboards
CFOs can start manually: spreadsheets, CSV exports, and allocation rules. But manual processes are slow, inconsistent, and vulnerable to lag. In wellness, where shipping surcharges can change week to week and returns spike seasonally, delay equals distortion.
This is where data ingestion and real-time dashboards provide leverage. Saras Analytics integrates data across:
- Commerce platforms (e.g., Shopify)
- ERP and inventory systems
- 3PL fulfillment providers
- Carriers and shipping systems
- Marketing and acquisition platforms
By unifying these sources, Saras Pulse delivers:
- SKU-level profitability → including COGS, fulfillment, packaging, and returns.
- Cohort analysis → trial vs subscriber vs wholesale, with ARPU and payback windows.
- Margin drivers and leak points → expiry risk, DIM weight surcharges, high-return SKUs.
CFOs no longer wait for analysts to reconcile spreadsheets or rely on averages. Instead, they log in and see contribution economics in real time.
Conclusion
Revenue growth is tempting to celebrate, but in health and wellness it often hides fragile economics. Hidden costs, from unsellable returns to liquid freight, can quietly erode margins and drain working capital. Without SKU- and cohort-level visibility, CFOs risk scaling losses instead of resilience— Talk to our Data Consultant to uncover actionable insights.

.png)
.svg)
%201%20(1).svg)

.png)


.png)


.png)


.png)


.png)


.png)


.png)


.webp)


.avif)


.avif)

.avif)
.avif)
.avif)
.avif)
%20(1).avif)
.avif)
%20(1).avif)
%20(1).avif)


