Control where
your Profit comes from

See the Micro P&L of Every SKU, Order, and Channel

Use Cases
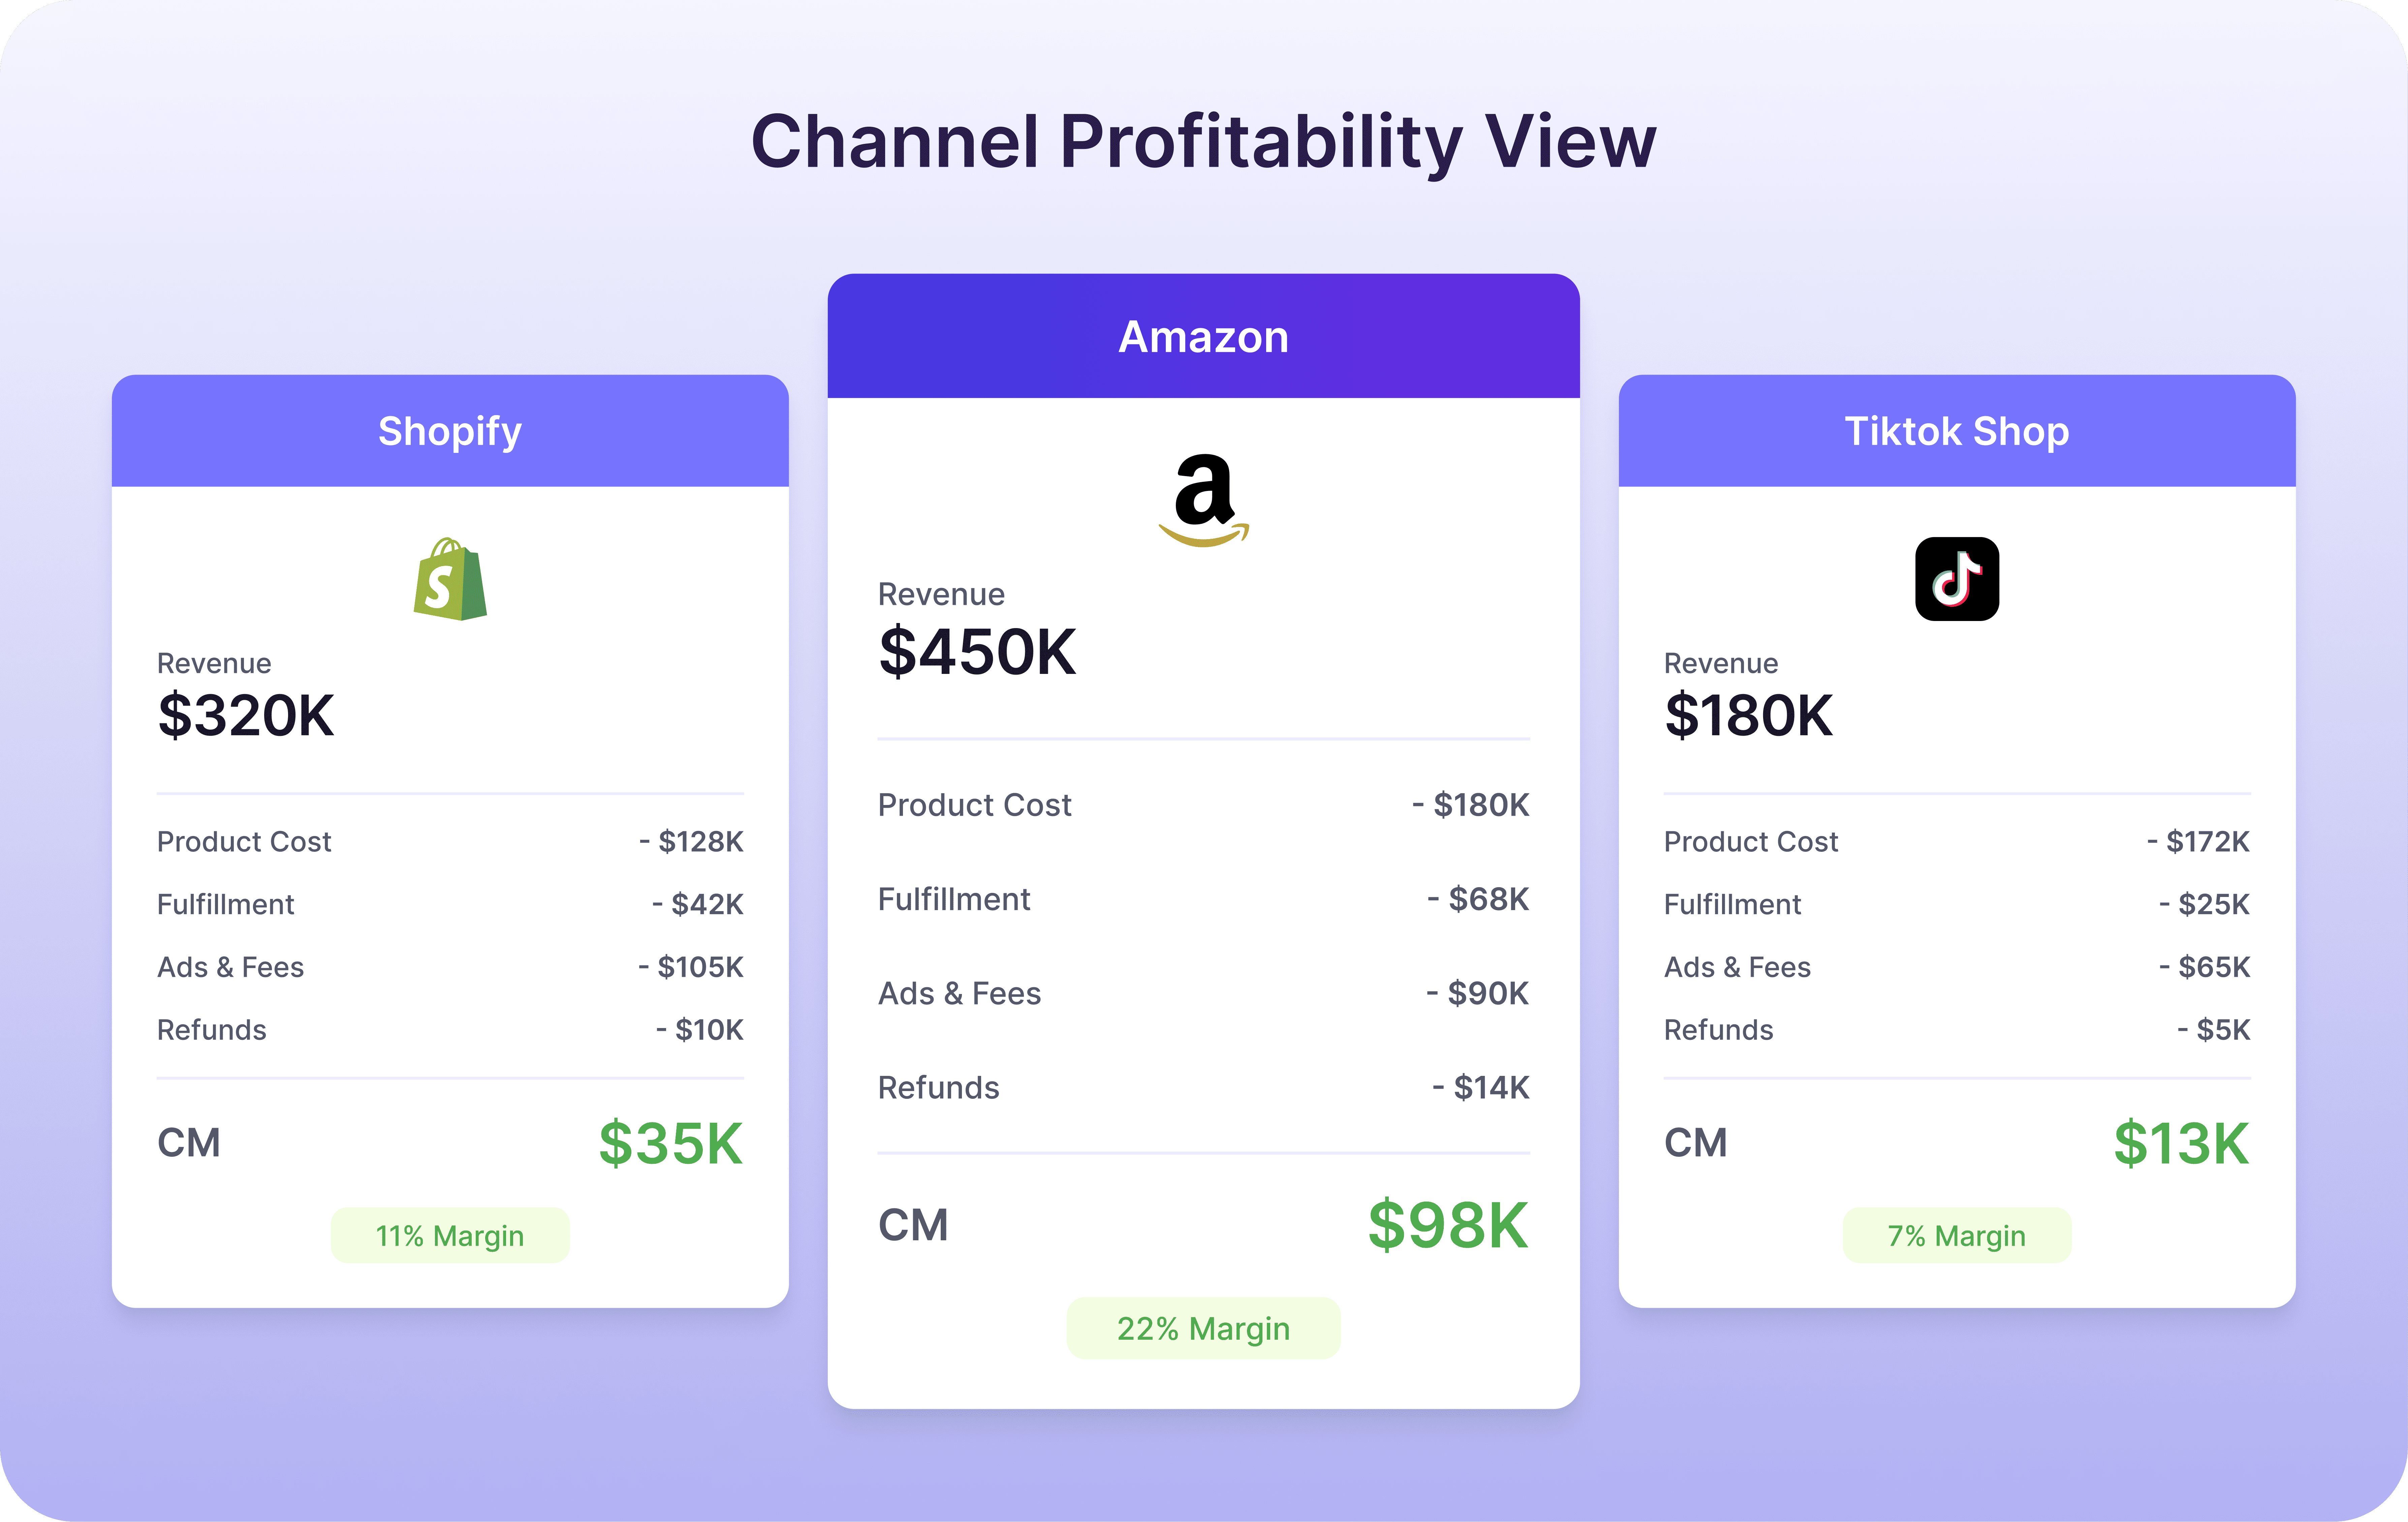
See which channels generate profit and which ones rely on it

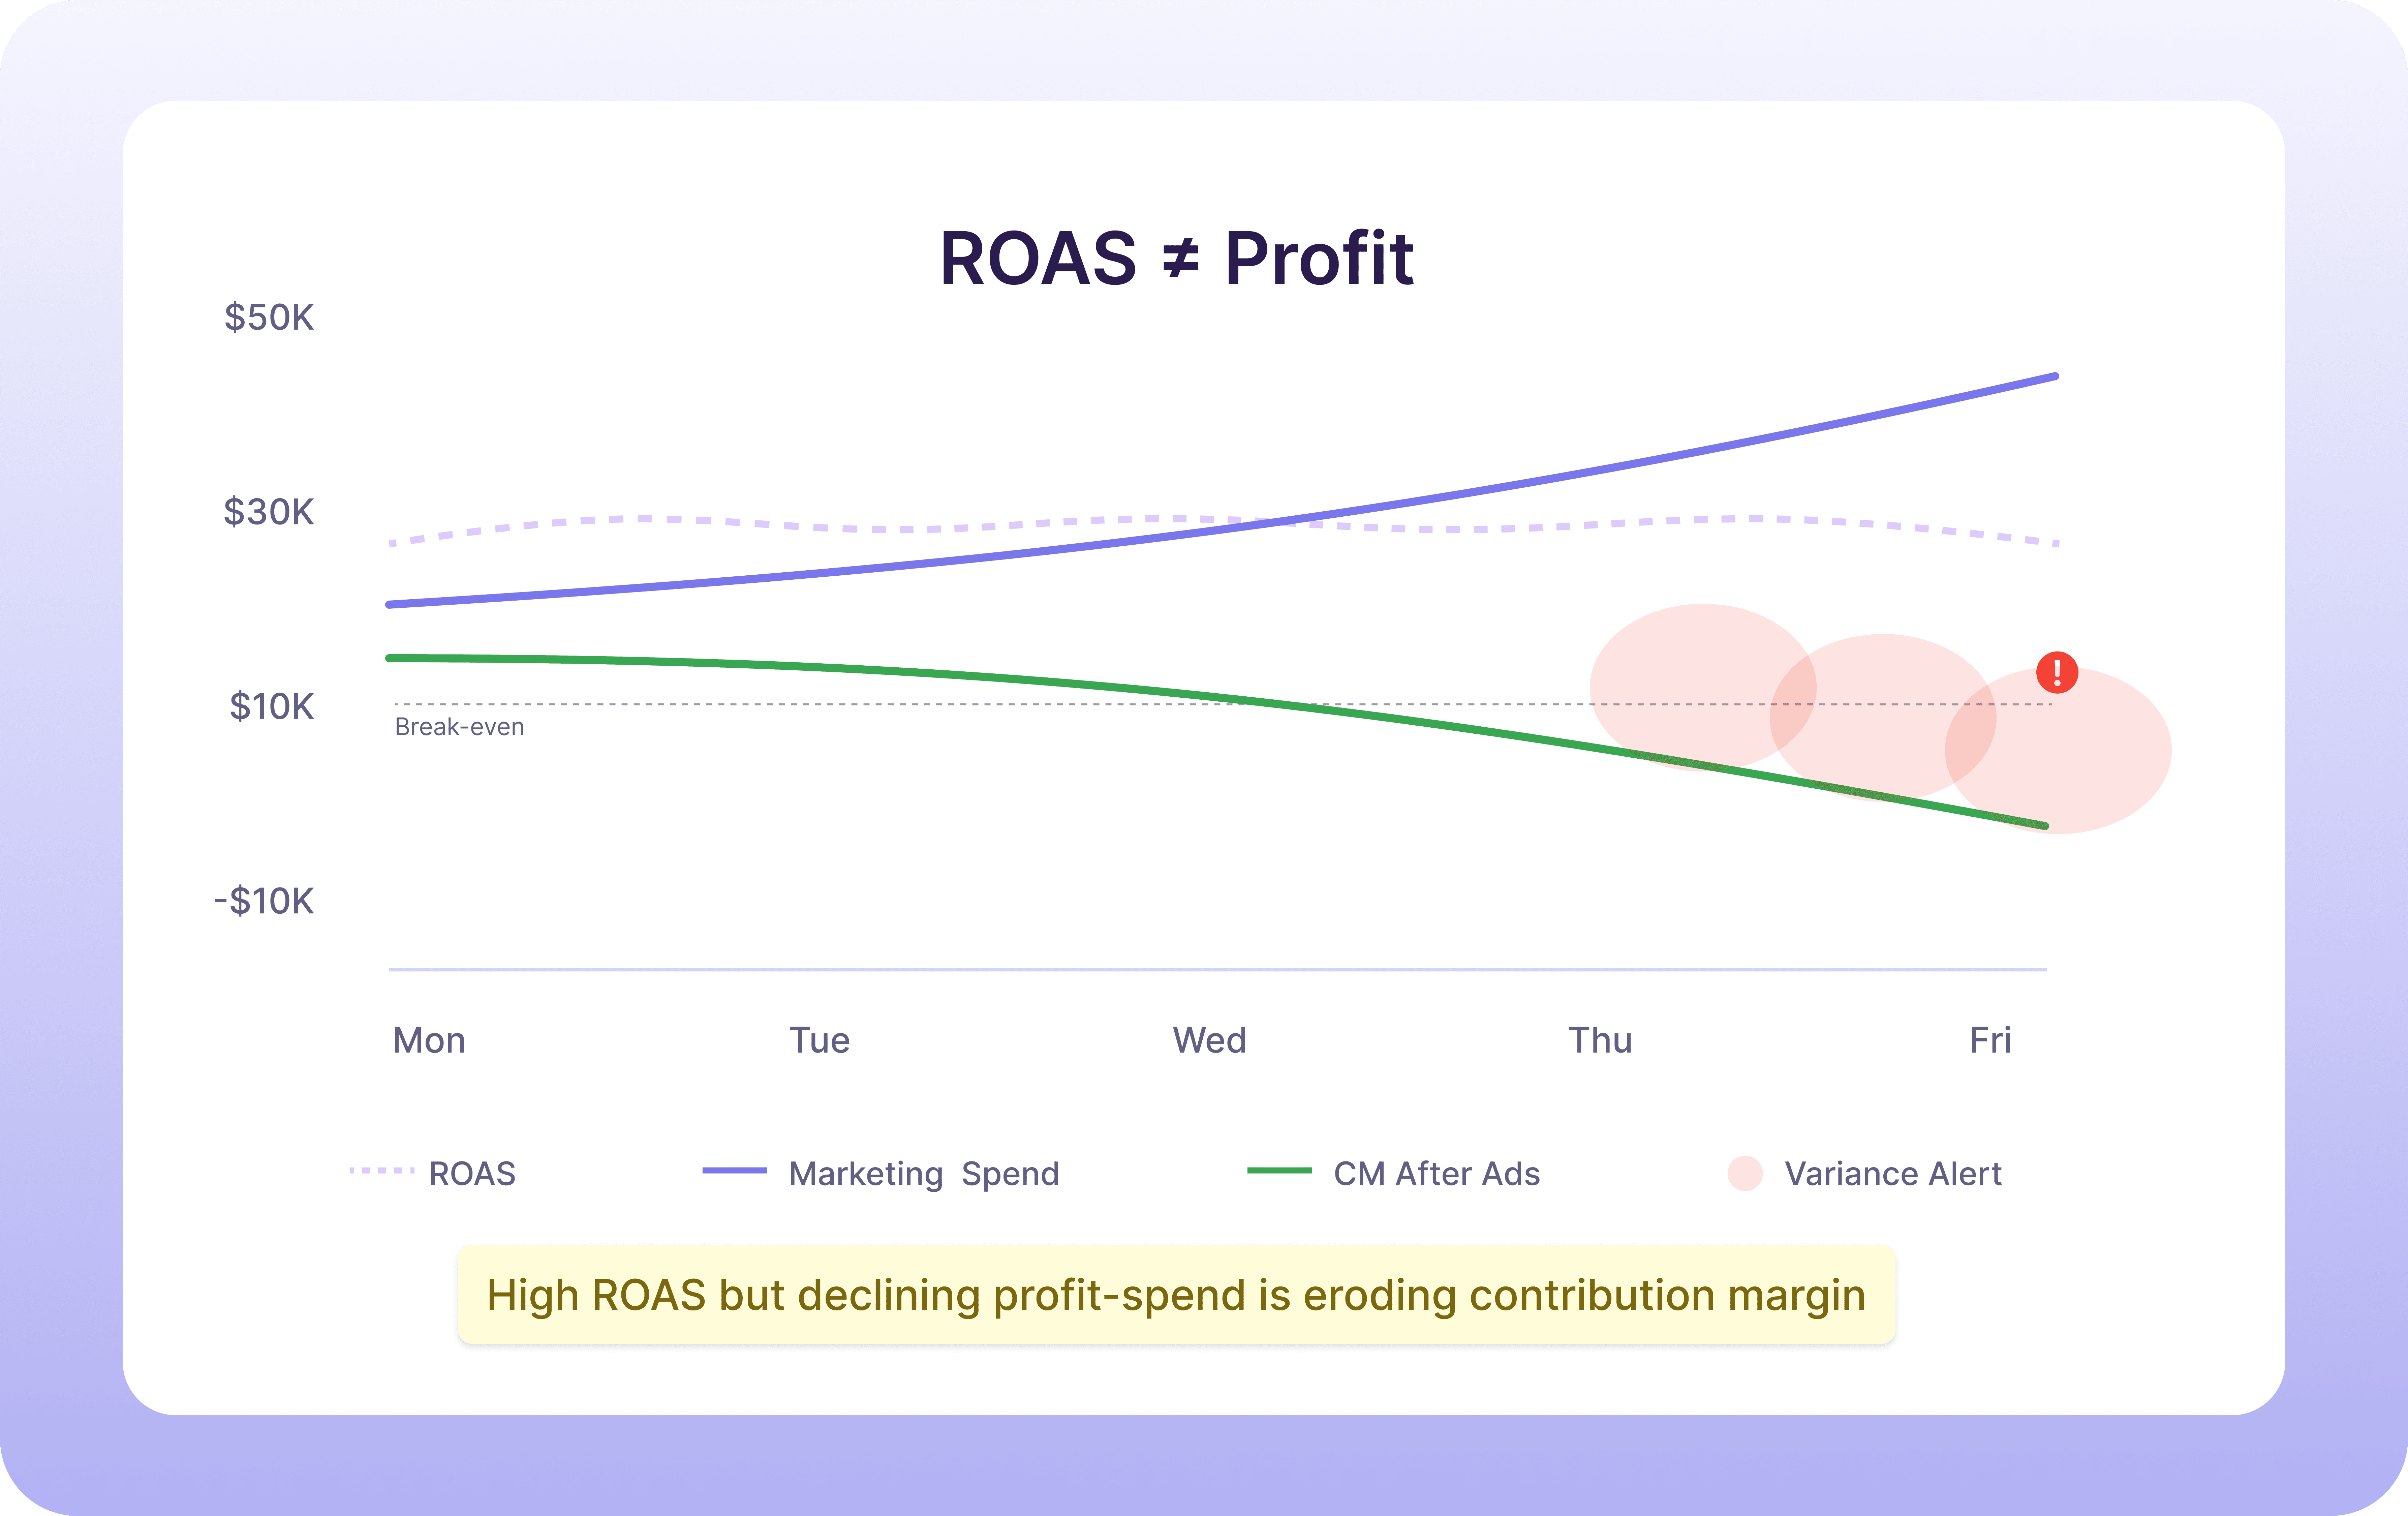
Understand when marketing spend helps the business and when it doesn't
Know how acquisition and retention economics really differ
.png)
Defend margin decisions with explainable micro costs, not percentages
.png)
Take quick decisions with pre-built reporting for daily, weekly, and monthly meetings


.png)
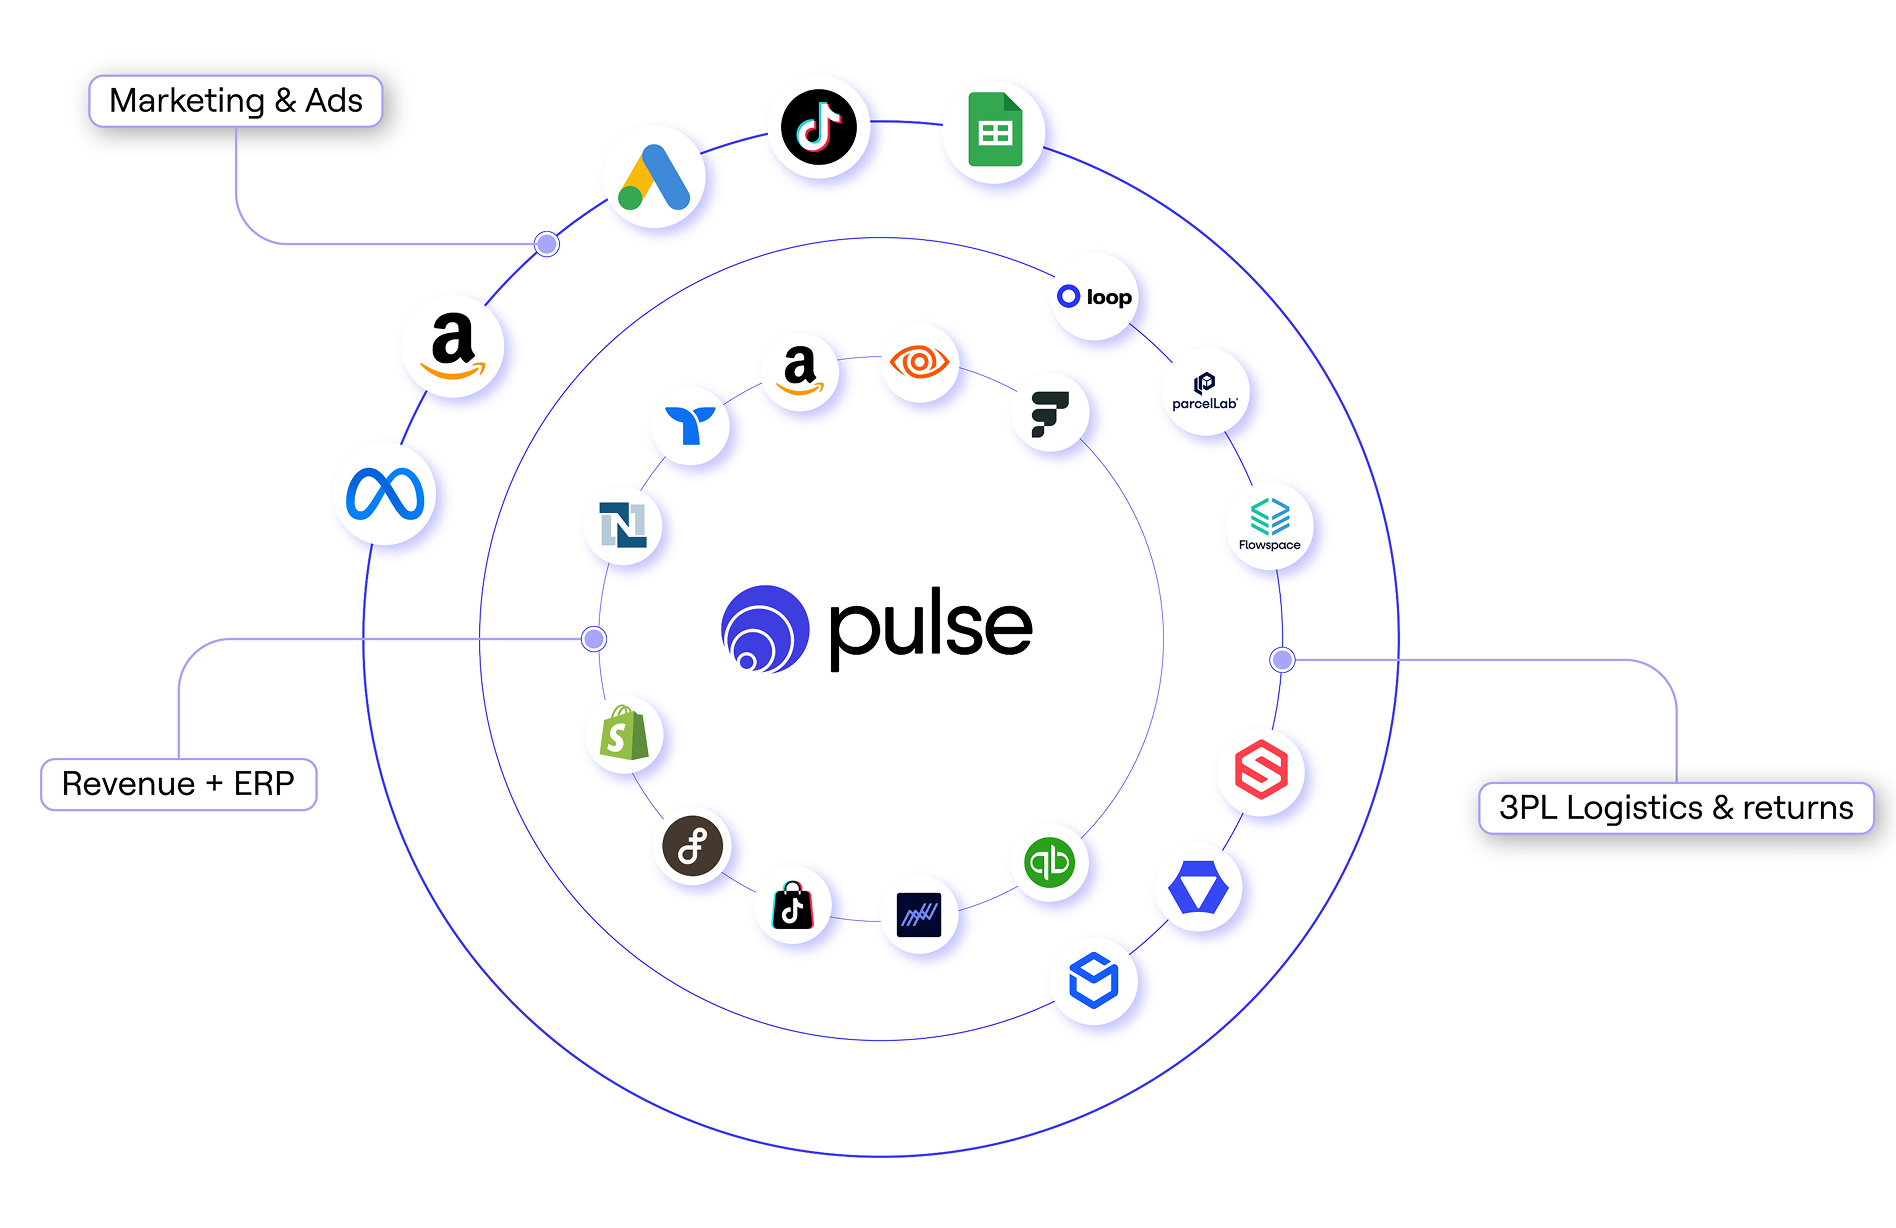
Unify data from 200+ sources to see your real Contribution Margin


.svg)

.avif)
See what the world's fastest growing e-commerce brands say

We are growing quickly, and my focus is to ensure the business has the clarity and structure it needs to scale effectively. Saras Pulse helped strengthen our foundation, improved consistency and visibility of our product and margin data. This work supports the level of analytical rigor we need as we move into our next stage of growth.


Every single day I'm going in there, looking at my contribution margin. I'm looking at my sales breakdown, my sales by product type.


Our dashboards pull in from everywhere, from Shopify, Amazon, our ERP, Costco, every single channel. We go to Saras Pulse and get our daily contribution margin reporting. We get all of our marketing metrics by channel, by category, even down to the SKU. Everything is pulled in automatically. I get an e-mail report in the morning. I go check things during the day. My entire team lives in this thing.


Read Saras Success Stories


.png)
.png)
.png)


.png)

.avif)

.avif)
.avif)
.avif)


.png)

.avif)
%20(1).avif)

.avif)

.jpg)


Frequently Asked Questions
Gross margin tells you if a product looks profitable. Contribution margin tells you if the business decision actually is profitable.
In e-commerce, contribution margin accounts for all variable costs tied to a sale, including shipping, returns, marketplace fees, payment processing, discounts, and marketing spend.
This makes CM the metric teams use to answer questions like:
- Are we making money on this SKU after ads and returns?
- Which channels scale profitably and which just scale revenue?
- Why does profitability change after month-end close?
If gross margin is a static accounting view, contribution margin is the operating truth teams use to run the business daily.
Because each team is using different assumptions, timing, and data sources.
What actually causes the mismatch:
- Finance sees CM after refunds, accruals, and late COGS
- Marketing sees CM before refunds or fulfillment adjustments
- Ops sees shipping and returns weeks later
- Marketplaces restate fees after the fact
This leads to three different “correct” numbers and zero confidence.
A true CM system reconciles order-level data across ERP, 3PL, ad platforms, and marketplaces, so every team works off the same definition, same timing, same number.
All three, but for different jobs.
Best-practice cadence used by scaled brands:
- Daily CM → Action
Adjust ad spend, pause SKUs, spot margin collapse early
- Weekly CM → Alignment
Leadership reviews tradeoffs across growth, ops, and finance
- Monthly CM → Accounting & reporting
Book-level accuracy and retrospectives
If CM only shows up after month-end close, decisions are already late.
High-growth teams treat CM as an operating metric, not a reporting artifact.
As granular as decisions require. In practice, teams use CM at:
- SKU level (which products actually make money)
- Channel level (Amazon vs Shopify vs retail)
- Campaign / ad-set level (what spend drives profit, not just ROAS)
- Customer cohort level (new vs repeat, subscription vs one-time)
- Geography & fulfillment lane level (shipping cost distortion)
Brands that only see “overall CM” still miss profit leaks hiding inside micro P&Ls.
Teams stop debating numbers and start acting faster.
What customers typically unlock:
- Confident budget shifts without double-checking spreadsheets
- Fewer surprises after month-end close
- Faster cross-functional decisions (marketing, ops, finance aligned)
- Clear visibility into which growth is profitable vs cosmetic
- Ability to scale without margins silently eroding
The biggest shift isn’t more data.
It’s trusting the number enough to act on it.
A reliable contribution margin stack pulls data from five core systems:
- Commerce platforms (Shopify, Amazon) for order-level revenue,
- Ad platforms (Meta, Google, Amazon Ads) for true demand costs, fulfillment and
- Carrier systems (3PLs, shipping rate cards) for delivery and returns costs,
- Finance/ERP systems (NetSuite, QuickBooks, SKU-level cost tables) for COGS and accounting alignment, and
- Returns/refunds tools (Shopify refunds, returns platforms, CX tools) to capture post-purchase margin erosion.
Together, these connectors ensure contribution margin reflects the actual cost of selling and fulfilling each order, not estimates—so teams can trust the number for daily decisions, not just month-end reporting.