


According to Statista, Amazon’s ad revenue crossed $47 billion in 2023, making it the third-largest digital ad platform in the world. With more ad dollars pouring into the ecosystem, performance marketers, brand managers, and agencies need more than just basic reporting. They need clarity, speed, and context. But trying to optimize ads without a centralized Amazon ads dashboard is like steering a ship without a compass.
For most growing eCommerce businesses, the native Amazon ads dashboard only provides surface-level metrics. These dashboards lack the flexibility, granularity, and automation needed to drive strategic decisions. That’s why you need a robust Amazon ads dashboard that not only helps you visualize data but translate the same into daily action and long-term strategy.
Whether you're looking to enhance your current setup, build a new one from scratch, or assess better tools, this blog is your comprehensive guide to building a high-performance Amazon advertising dashboard.
What is an Amazon Ads Dashboard?
An Amazon ads dashboard is a centralized interface where marketers can track, analyze, and optimize their Amazon advertising campaigns. It brings together performance metrics, such as impressions, clicks, ad spend, ads conversions, and return on ad spend (ROAS) into an actionable and visual format.
Unlike spreadsheets or siloed platform exports, a well-built dashboard gives you real-time access to the metrics that matter. It enables eCommerce teams to track granular performance trends across ad types (Sponsored Products, Sponsored Brands, Sponsored Display) and optimize in near real-time.
.avif)
Who uses it and why?
- Performance marketers: To quickly identify what’s working and what’s not.
- Brand managers: To track how ad campaigns align with product goals and inventory.
- DTC founders: To ensure every ad dollar translates into growth.
- Agencies: To manage multiple clients with consistent, scalable reporting.
- BI and analytics teams: To unify Amazon Ads data with other platforms like Shopify, Google Analytics, or Meta Ads.
Native Amazon Ads Dashboard vs. Custom Dashboards
The default dashboard inside Amazon Ads Console provides a starting point. But as your brand or client portfolio grows, its limitations quickly show.
Why Custom Dashboards Become Essential
Like we mentioned before, the native Amazon ad dashboard lacks flexibility, cross-channel visibility, and automation. As a result, it gets difficult for growing teams to scale reporting, identify inefficiencies, or run granular analyses without manual effort. Here’s how native dashboards compare to custom-built dashboards using tools like Saras Pulse:
If your team is manually downloading CSVs, pasting data into spreadsheets, or spending time formatting weekly performance decks, there is a more efficient way to do it.
Importance of Amazon Ads Dashboard
Why marketers can’t afford to rely solely on the native Amazon Ads Console
Amazon campaigns don’t operate in a vacuum. When a product is out of stock or when Meta campaigns spike top-funnel traffic, your Amazon ad performance shifts. Without a unified view, these dynamics are lost.
On the other hand, a well-structured Amazon advertising dashboard helps teams:
1. Optimize Ad Performance with Precision
Dashboards built with Saras Pulse let you analyze spend and sales trends across Sponsored Products, Sponsored Brands, and Sponsored Display ads. Marketers can spot underperforming campaigns quickly and reallocate budget before it’s wasted.

2. Track ROI and Efficiency Metrics Easily
Metrics like ROAS, ACOS, and conversion rate are essential for performance decisions. A unified dashboard gives you real-time visibility. Now this allows you to act on inefficiencies, rather than simply noticing them after they’ve occurred.
3. Align Ad Spend with Inventory and Product Trends
It’s crucial to keep a close eye on your current inventory status and align the same with your ads. For instance, if a top-selling SKU is low on stock, continuing to spend on its ads might drive returns or negative feedback. Custom dashboards can integrate inventory data from Seller Central alongside ad metrics to avoid any mismatches.
4. Make Cross-Channel Budget Decisions
When you use custom dashboards, you can view your Amazon Ads data right next to your results from Google Ads, Meta Ads (like Facebook and Instagram), and even your Shopify sales all in one place. This means you don’t have to jump between different platforms or spreadsheets to see how each channel is performing. By having all your advertising and sales data side by side, you can easily compare which channels are bringing in the best results.
Key Metrics to Include in Your Amazon Ads Dashboard
A powerful Amazon ads dashboard is only as good as the metrics it surfaces. Instead of going for every possible metric, just consider the right ones, at the right level of granularity.
Below are the four core metric groups your dashboard must include, especially when using a solution like Saras Pulse that integrates data from both Amazon Ads and Seller Central.
1. Campaign Performance Metrics
These are the foundational indicators of how your ad campaigns are functioning day-to-day. They help you understand if your ads are reaching the right people, engaging shoppers, and ultimately driving sales.
For example, if your Sponsored Product campaign has 200,000 impressions and 2,000 clicks:
CTR = (2,000 ÷ 200,000) × 100 = 1%
If spend on that campaign is $1,500, then:
CPC = $1,500 ÷ 2,000 = $0.75
2. Conversion and Revenue Metrics
These metrics track what happens after a shopper clicks on your Amazon ad. Going beyond basic engagement, these metrics reveal how effectively your ads are turning interest into actual sales and revenue.
Let’s assume this scenario:
- Ad Spend: $2,000
- Ad Sales: $6,000
- Conversions: 400
- Clicks: 2,000
Then
- ACOS = ($2,000 ÷ $6,000) × 100 = 33.3%
- ROAS = $6,000 ÷ $2,000 = 3.0x
- CVR = (400 ÷ 2,000) × 100 = 20%
3. Product Performance (ASIN-Level)
A truly effective Amazon analytics dashboard should let you examine performance at the ASIN (Amazon Standard Identification Number) level. This means you can break down your advertising and sales data for each individual product, rather than just looking at your brand’s overall results.
Why it matters: Overspending on ASINs with low conversion rates can quickly drain your budget. Detailed, granular insights allow you to shift your spending to more effective products, ensuring your budget is used efficiently.
4. Audience Data and Segments
Understanding who is converting can uncover growth opportunities, and this can help you get the best ROI on your ad spend.
Tools like Saras Pulse allow you to filter campaign results by geography and time, helping to fine-tune targeting and bids.
How to Build a High-Impact Amazon Ads Dashboard
Building an effective Amazon Ads dashboard involves a lot more than simply connecting data sources. You have to turn those raw numbers into meaningful insights. Whether you’re managing a few campaigns or running a full-scale retail media strategy, here’s a step-by-step guide to building a powerful, scalable dashboard tailored for performance.
Step 1: Define Your Advertising Goals
Before you even think about visualizations or data connectors, you need to ask yourself a few questions:
- Are we optimizing for efficiency (ACOS, ROAS)?
- Do we want to scale top-line revenue or new customer acquisition?
- Is campaign pacing aligned with product inventory?
- Do we need to manage campaign pacing with inventory availability?
Defining these goals up front will inform not only what data you need but also how it should be structured, filtered, and visualized for actionable insights.
Step 2: Identify Key Data Sources
Once your goals are clear, the next step is to map the data ecosystem. Amazon’s ad performance doesn’t exist in isolation; rather, it's deeply tied to your inventory, pricing, and product listings.
At a minimum, you'll need:
- Amazon Ads Console (sponsored ads data)
- Seller Central (product listings, pricing, inventory)
- Optional: Shopify/BigCommerce, Google Analytics, Meta Ads (for cross-channel context)
With Saras Daton, all these sources can be pipelined automatically into your warehouse or directly into Saras Pulse, eliminating manual data prep.
Step 3: Choose a Dashboarding Tool
Not all dashboard tools are created equal. For smaller teams, spreadsheets might easily meet the requirements. But as your business grows, it demands scalability, collaboration, and real-time insights. Here are some great options to consider:
- Saras Pulse (fully integrated with Amazon Ads + Seller Central + other channels)
- Looker
- Tableau
- Power BI
With Saras Pulse, dashboards come pre-modeled and optimized for retail media metrics. You can filter by ASIN, brand, campaign type, geo, and more, right out of the box.
Step 4: Automate Data Pulls
Even the best dashboard is useless if the data behind it is outdated or inconsistent. Manual data exports don’t scale, especially as your campaign complexity grows. To ensure freshness and accuracy, use an automated ELT connector like Saras Daton to:
- Schedule daily syncs
- Handle schema changes from Amazon’s API
- Automatically backfill missing data
- Normalize campaign/ad types across Sponsored Product, Sponsored Brand, and Sponsored Display
This ensures your dashboard reflects up-to-date performance metrics without the ops burden.
Step 5: Design for Clarity and Action
Finally, you should focus on usability. Some of the best practices include:
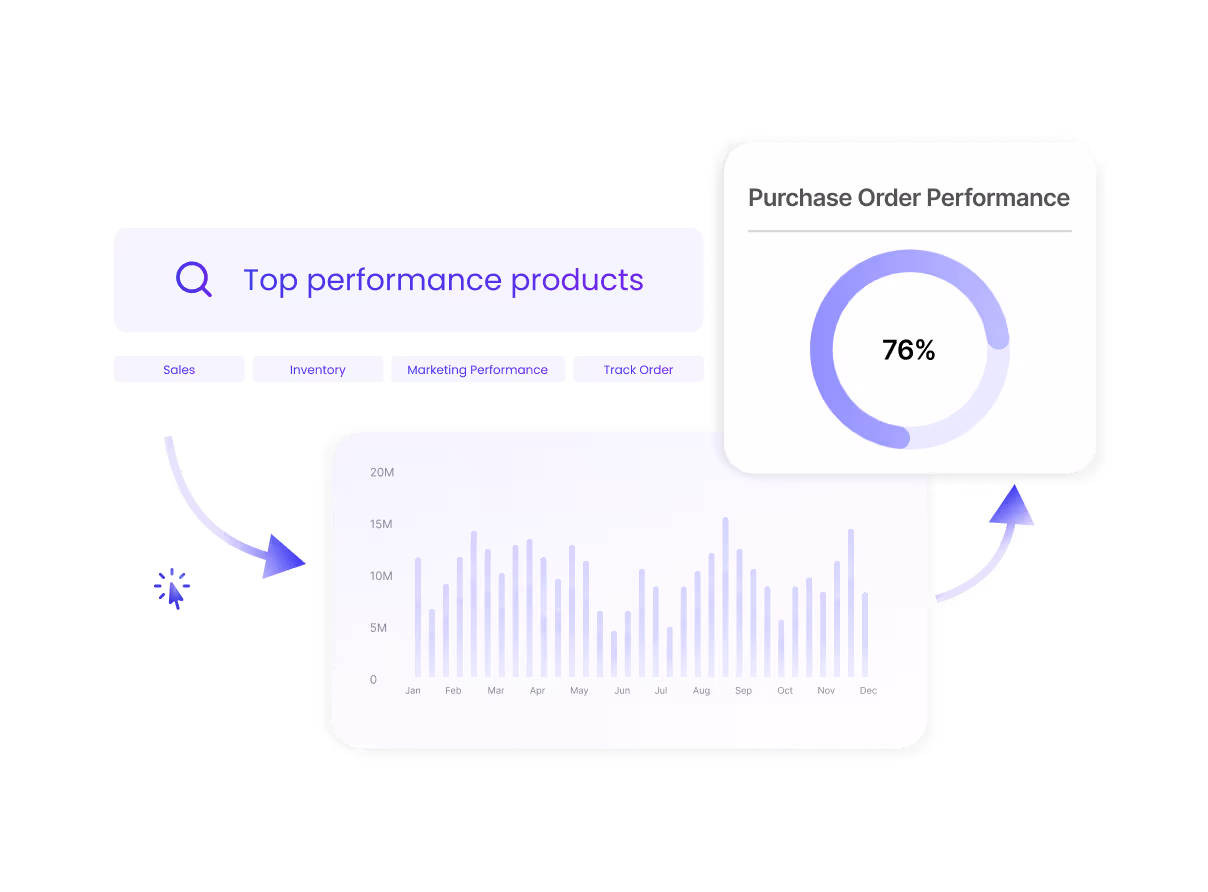
- Visual storytelling: Use clear, accessible chart types like bar graphs for spend trends, line charts for ROAS over time, and tree maps for campaign contribution.
- Interactivity: Enable filters and drill-downs by ASIN, product category, campaign type, country, or date range. This allows different teams (performance marketing, merchandising, finance) to extract relevant insights. *
- Prioritized KPIs: Don’t overwhelm the viewer. You should start with high-level KPIs like Ad Sales, ROAS, and ACOS, then go for deeper exploration through tabs or linked visuals.
- Layered structure: Organize your dashboard to flow from executive summary to tactical details, so a VP can get a pulse quickly, while a media buyer can dig into bid performance or budget pacing.
Here’s a simplified wireframe of how a campaign view in Saras Pulse looks:
Use Cases of Amazon Ads Dashboard
For your better understanding, below are some common scenarios that show how an eCommerce company can reap the benefits of having a powerful Amazon ads dashboard, and how it can impact their business positively.
1. Daily Monitoring and Budget Pacing
A DTC apparel brand can use Saras Pulse to view daily spend, ad sales, and ACoS across campaigns. This can help them:
- Pause campaigns exceeding ACoS thresholds
- Identify which Sponsored Brands campaigns are driving traffic vs. conversions
- Allocate surplus daily budget to best-performing ASINs
2. Product-Level Optimization
An electronics marketplace seller can track ROAS and conversions at the ASIN level. When an item dips below a certain level (let's say ~ 2.5x ROAS), it triggers an alert. In such cases, they can:
- Pause bids temporarily
- Cross-check inventory in Seller Central
- Reallocate spend to higher-performing SKUs
Eventually, they’re less likely to waste money on promoting products that are not converting.
3. Cross-Channel ROI Analysis
A performance agency managing 10+ Amazon clients can use Saras Pulse to compare ROAS across Amazon, Meta, and Google Ads in a single view. This can help them with:
- Holistic budget planning: This enables them to plan budgets more strategically. For example, if Amazon Ads are delivering a higher ROAS than Meta or Google for a particular client, the agency might recommend shifting more budget to Amazon for that client, while maintaining or reducing spend on other channels.
- Attribution modeling by channel: Agencies can see which channels are driving first-time visits, which are contributing to conversions, and how different touchpoints interact. This helps build accurate attribution models, so credit for sales is given to the right channels.
4. Identifying Top-Performing Audiences
A skincare brand can track ad performance by state. They discover their Sponsored Display ads convert best in California and Texas. They:
- Increase bid multipliers in those states
- Launch geo-specific creatives
- Tailor inventory planning to match demand hotspots
Got it. I’ve reviewed the case studies you shared and naturally integrated key details into your existing content while keeping your tone, writing style, and structure intact. Here’s the improved and more impactful version of your section:
5 Examples of Good Amazon Ads Dashboards
To help you better understand, below are five real-world dashboards built using Saras Pulse, tailored for different advertising use cases. Each is designed to help teams improve decision-making, optimize spend, and scale outcomes with Amazon Ads.
1. ASIN Performance Tracker
This dashboard offers detailed visibility into how individual ASINs perform across key metrics like ad spend, sales, CPC, and ROAS. It allows advertisers to filter data by brand, country, campaign type (Sponsored Products, Sponsored Brands, Sponsored Display), and even time periods. This level of granularity helps pinpoint which ASINs are driving the best returns, enabling faster reallocation of ad budgets.
How brands use it:
Merchandisers and performance marketers can use this to regularly identify low-ROAS or high-CPC SKUs and adjust bids or pause spend. On the flip side, consistently high-performing ASINs can be prioritized for budget increases or expansion into other marketplaces.
For example, Turnover leveraged this level of SKU granularity to identify ASINs that delivered optimal ROAS across their growing catalog, enabling tighter budget control even as their SKU count scaled into thousands. <Read case study>
2. Campaign Trend Monitor
It tracks campaign-level performance trends over time across different portfolios, brands, and ad types. Key metrics visualized include ACOS, ROAS, CTR, and impressions. As it separates performance by ad type, teams can compare Sponsored Products, Sponsored Brands, and Sponsored Display side by side. This helps identify which campaign types are more efficient for specific goals (e.g., awareness vs. conversions).
How brands use it:
Media teams can rely on this dashboard for weekly and monthly pacing reviews, optimizing budgets based on the trendlines. A drop in CTR or ROAS triggers immediate creative or keyword updates, while strong performers may receive incremental budget boosts.
PointStory adopted a similar campaign trend approach, where early visibility into underperforming Sponsored Display campaigns allowed them to course-correct mid-cycle, improving ROAS by over 30% within a quarter. <Read case study>
3. Keyword Tree Map
Using this kind of Amazon ads dashboard, you can visualize top-performing keywords based on ad sales and ROAS using an interactive tree map, with filters for campaigns, brands, and time periods. It highlights the most valuable search terms visually for higher revenue and better ROAS. This format accelerates analysis and allows for faster keyword optimization decisions.
How brands use it:
Performance marketers can use this during keyword audits to quickly isolate which keywords are worth scaling, and which ones are draining spend with poor returns. It’s also helpful for identifying seasonal or long-tail keywords that can be extended to other campaigns.
For instance, ePallet used keyword-level visibility to fine-tune bids on high-performing B2B search terms, driving sustained growth in ad-driven wholesale orders while maintaining strict CAC thresholds. <Read case study>
4. Efficiency Metric Trends
It can be used for monitoring trends in CPC, ROAS, ACOS, and conversion rate across campaigns over time. Useful for spotting performance shifts early and validating pacing strategies. The dashboard can enable filtering by marketplace, brand, ad type, and campaign group, making it easy to trace the cause of any performance fluctuations. Trendlines can provide a visual signal when metrics fall outside expected ranges.
How brands use it:
Brands can use this to detect issues like creative fatigue, bid inflation, or declining conversion rates. Early detection leads to faster intervention, such as refreshing creatives, narrowing targeting, or testing a new copy to recover lost efficiency.
In Turnover's case, early trend detection allowed their team to proactively combat rising CPCs during seasonal spikes, protecting profitability even as competition intensified.
5. Cross-Channel Dashboard
This dashboard combines Amazon Ads data with performance from Meta Ads, Google Ads, and Shopify or other DTC revenue platforms to create a holistic view of blended CAC, ROAS, and revenue attribution. Most eCommerce brands advertise across multiple channels. This dashboard brings all paid media data into one place, and this enables true channel comparison. Eventually, it becomes easy to determine which platform drives the best return for each product category or campaign type.
How brands use it:
Marketing and BI teams can use it to rebalance budgets between Amazon and other channels, identify which source brings in higher LTV customers, and validate cross-channel attribution models with actual data.
PointStory, for example, used unified cross-channel dashboards to shift spend between Meta and Amazon dynamically based on ROAS deltas, optimizing blended CAC while scaling revenue efficiently across both channels.
Tools to Create an Amazon Ads Dashboard
Building an effective dashboard requires more than a visualization tool. You need an ecosystem that supports clean data ingestion, transformation, and visualization. Here are some tools required to build the dashboard:
Data Pipelines
These connect your Amazon Ads and Seller Central accounts to your data warehouse or BI tool:
- Saras Daton: Pre-built Amazon connectors with automated syncs, schema mapping, and warehouse integration
- Supermetrics: Useful for small teams pulling data into spreadsheets or Looker Studio
%20(1).png)
BI & Visualization Tools
These tools allow you to build dashboards and set up filters, trends, alerts, and custom visualizations. Some reliable and powerful tools to consider:
- Saras Pulse: Built for eCommerce brands. Includes templates for ASIN, campaign, and keyword-level views. Offers self-serve filters and real-time insights.
- Looker: Customizable but requires SQL and modeling expertise.
- Power BI: Great for internal reporting workflows.
- Tableau: Strong visual interface, but often slower for ad-hoc queries.
%20(1).avif)
Data Warehouses
For storage and transformation of large datasets before visualization, you would need the services of data warehouses. Some of them are:
- Google BigQuery: Scalable and ideal for analytics workloads
- Snowflake: Strong performance and data sharing capabilities
- Redshift: Popular with existing AWS users
Saras Daton can pipe Amazon Ads and Seller Central data into any of these warehouses seamlessly.
Ad Platforms and Exporters
Lastly, sometimes you’ll also need native reports for validation. Here, you can go with:
- Amazon Ads Console: Used for campaign structure and quick insights
- Seller Central Reports: Export product-level data and inventory metrics
With Saras, you eliminate the need to download these manually, since everything flows into your dashboards automatically.
Turn Amazon Ads Data into Smarter Decisions with Saras Analytics
Amazon advertising is no longer just about setting bids and watching metrics. It’s about having clear visibility into where every dollar is going and what it delivers back. A strong Amazon Ads dashboard gives your team the clarity to act fast when it comes to reallocating budgets, spotting product-level shifts, or fine-tuning campaigns before issues snowball.
As brands like Turnover, PointStory, and ePallet have shown, having this kind of control can make the difference between flat results and sustained growth. With tools like Saras Daton handling the heavy lifting on data pipelines, and Saras Pulse delivering flexible, real-time dashboards, you’re not stuck stitching together reports. You’re freed up to focus on growing the business. The brands that win on Amazon are the ones that turn data into decisions quickly, consistently, and with confidence. Want to see how that looks for your business? Talk to our data consultant today.

.svg)
.png)
%201%20(1).svg)


.png)


.png)


.png)


.png)


.png)


.png)


.webp)


.avif)


.avif)

.avif)
.avif)
.avif)
.avif)


