


Customer teams today face a consistent set of problems:
- Customer actions are spread across ads, websites, apps, email, and devices
- Reports explain “What” happened, not “Why” it happened
- Insights arrive too late to influence conversion or retention decisions
- Teams rely on assumptions, last-click metrics, or static segments
Customer behavior analysis tools address these gaps by connecting actions across the whole journey and tying behavior directly to conversion, retention, and lifetime value. Teams get a view of how customers move, hesitate, and return, and where intervention actually changes outcomes.
McKinsey’s research on personalization and customer analytics shows that companies using advanced behavioral insights outperform peers on conversion and retention, directly improving customer lifetime value while reducing acquisition inefficiencies.
This article helps buyers evaluate customer behavior analysis tools by breaking down what they are, how they work, the main market categories, and how to assess platforms based on real business impact across conversion, retention, and LTV.
Is your data actually Decision-Grade?
9 questions. 3 minutes. Score your Profitability Visibility and Readiness for AI-driven growth.
Start Free Diagnostic
What Are Customer Behavior Analysis Tools?
Customer behavior analysis tools collect, unify, and analyze customer interaction data to understand behavior patterns, intent, and decision drivers across the full customer journey.
“Behavior” in this context includes:
- Browsing and click behavior across web and apps
- Funnel movement and drop-off points
- Purchase, repeat purchase, and churn behavior
- Engagement with emails, ads, and content
- Signals of friction, hesitation, or intent
A common misconception is that these tools are just advanced dashboards. In reality, they go beyond reporting outcomes. They translate raw actions into insights that explain why customers act, predict what they may do next, and support timely intervention across marketing, product, and retention.
Why Customer Behavior Analysis Matters for Modern Businesses
Customer behavior analysis matters because it connects day-to-day actions to commercial outcomes. Without this connection, teams optimize channels, campaigns, or experiences in isolation, often improving activity metrics without improving revenue or retention.
Here’s where behavior analysis creates measurable impact:
1. Improves Conversion by Identifying Friction Early
Behavior analysis shows where users hesitate, loop, or abandon before checkout or signup. This allows teams to fix high-impact drop-offs instead of optimizing pages based only on averages.
McKinsey reports that companies using advanced customer analytics and behavioral insights see conversion improvements driven by clearer identification of journey friction and intent signals.
2. Reduces CAC by Focusing Spend on High-Intent Behavior
When teams understand which behaviors correlate with conversion, they can shift spend away from low-intent traffic and toward actions that signal readiness to buy.
McKinsey’s personalization research shows that behavior-led targeting reduces wasted acquisition spend by aligning marketing investment with real customer intent.
3. Increases LTV Through Behavior-Based Personalization
Personalization based on observed behavior outperforms static segments built on demographics or past purchases alone.
A Forrester study cited by SuperAGI found that brands using AI-driven, behavior-based personalization achieved up to a 20% increase in customer satisfaction, a leading indicator of higher repeat purchase rates and customer lifetime value.
4. Enables Proactive Retention Instead of Reactive Churn Analysis
Behavior analysis surfaces early churn signals such as reduced engagement or pattern changes, allowing intervention before revenue is lost.
As explained in Saras Analytics’ analysis of ecommerce customer lifetime value, identifying behavioral drop-offs early plays a direct role in improving retention and protecting long-term revenue by addressing churn risks before they impact LTV.
5. Supports Aligned Decisions Across Teams
When behavior is tied to revenue and lifecycle outcomes, growth, product, marketing, and finance teams work from the same signals instead of conflicting dashboards.
In short, teams that understand customer behavior act earlier, spend more precisely, and grow more predictably than teams that only track outcomes.
Categories of Customer Behavior Analysis Tools
Each category is designed to answer different questions and supports various types of decisions. Understanding these categories helps teams avoid buying tools that report activity when the real need is insight or action.
10 Best Customer Behavior Analysis Tools in 2026
Customer behaviour analysis is not one-size-fits-all. Some focus on experience diagnostics, others on event tracking, and some on revenue intelligence. The tools below represent the most commonly evaluated platforms, each suited to different use cases.
1. Saras Pulse
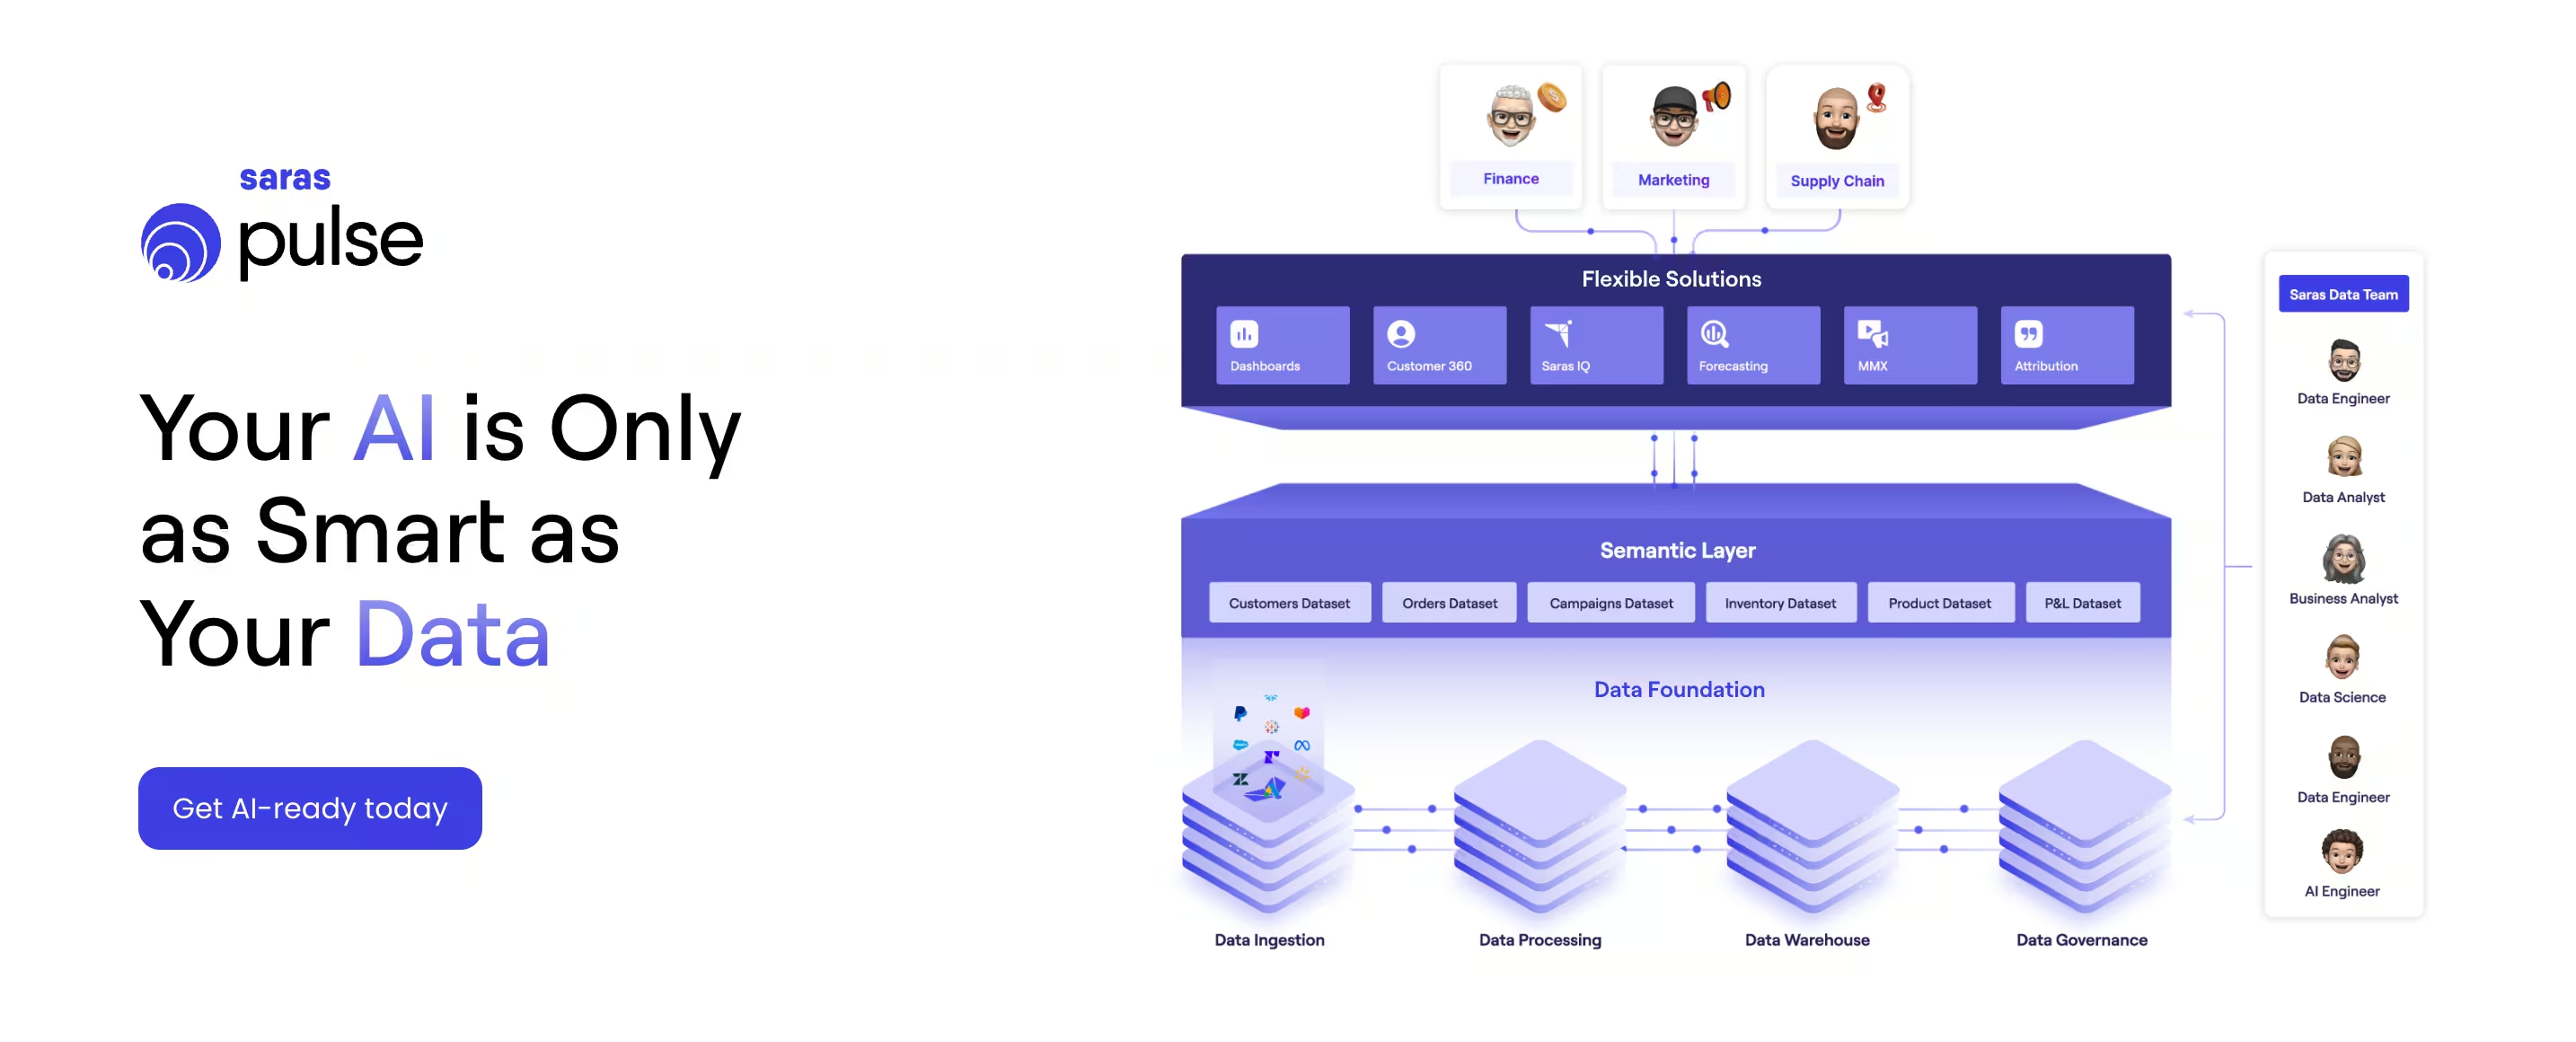
Saras Pulse is an analytics and BI platform built specifically for ecommerce and omnichannel retail teams. It delivers a unified, decision-ready view across customer behavior, marketing attribution, finance, and operations.
Instead of fragmented dashboards or static reports, Saras Pulse focuses on trusted metrics, shared definitions, and cross-team alignment so decisions are based on the same customer and revenue reality.
Key Features of Saras Pulse
1. Real-time segmentation: Saras Pulse's segmentation engine is described as "dynamic" and "auto-updating". Segments refresh automatically as new data comes in, ensuring they always reflect the latest customer behavior.

2. Unified customer profiles: The platform connects various data sources to merge all relevant events into a "unified customer profile" or "single source of truth". This combines data from marketing, sales, and orders to give a 360-degree view of each customer.
3. AI-powered predictions: Saras Pulse uses AI/ML algorithms within its cohort analysis to provide deeper insights. This feature helps businesses forecast lifetime value (LTV) and churn risk.
4. Visual segment builder: The platform allows users to create segments using simple dropdown menus and conditions in an intuitive interface, eliminating the need for a data analyst or SQL knowledge.
5. Extensive integrations: Over 200 connectors, including Shopify, Amazon, Klaviyo, Meta Ads, and GA4, help centralize data fast.
Pros and Cons of Saras Pulse
Saras Pulse Is Best For
- Growing and mid-market ecommerce brands
- Omnichannel retailers selling across DTC, marketplaces, and retail
- Teams where marketing, finance, and operations rely on the same metrics
- Organizations moving beyond spreadsheets or generic BI tools into decision-ready analytics
Saras Pulse’s Customer Ratings And Testimonials
Saras Pulse is consistently cited for improving clarity, consistency, and confidence in decision-making across ecommerce, marketing, and finance teams.
An SVP of Finance at Momentous shared:
“We are growing quickly, and my focus is to ensure the business has the clarity and structure it needs to scale effectively. Saras Pulse helped strengthen our foundation and improve consistency and visibility of our product and margin data.”
Similarly, the Head of Ecommerce and Retention at Momentous noted:
“The ability to monitor the impact of various initiatives on retention in real time through cohort dashboards changed how we lead both our DTC and Amazon channels.”
In this 9Operators Podcast, Krishna Poda (CEO - Saras Analytics) shares how Saras Pulse and IQ helped brands like HexClad and Ridge refine their customer segmentation strategies. By moving beyond static reports, these brands gained daily visibility and AI-driven insights that improved how they understand and target their audiences.
Across testimonials, customers highlight trusted metrics, real-time cohort insights, and cross-channel visibility as reasons Saras Pulse has become central to managing growth, retention, and profitability.
SarasPulse’s Pricing
Saras Pulse offers Growth and Enterprise plans.
Growth plan starts at $300 per month ($250 per month billed annually) and includes standard features, 200+ integrations, a managed data warehouse, and up to 10 users
Enterprise pricing is custom, designed for larger teams with advanced data needs, unlimited users, custom logic, and dedicated support
2. Contentsquare
Contentsquare is a customer experience analytics and customer segmentation platform that helps businesses understand user behaviour and identify growth opportunities. It combines behavioural, UX, and product analytics to help marketing and product teams improve engagement and conversion through data-backed insights.
Key Features of Contentsquare
- Experience Analytics: Captures complete user journeys without manual tagging.
- Voice of Customer: Integrates surveys and feedback for qualitative insights.
- AI-Powered Insights: The Sense AI agent provides instant analysis and recommendations.
- Session Replay & Heatmaps: Visual tools to detect friction points in the customer journey.
Pros and Cons of Contentsquare
Contentsquare Is Best For
- Product and UX teams focused on identifying usability issues and journey friction
- Marketing teams optimizing on-site engagement and experience performance
- Organizations prioritizing qualitative and visual behavior analysis
- Teams that need experience diagnostics rather than revenue or lifecycle intelligence
Contentsquare’s Pricing
Contentsquare offers a Free plan (up to 20k sessions/month), a Growth plan starting at $40/month (billed annually), and custom pricing for Pro and Enterprise tiers based on session volume and feature access.
3. Mixpanel
Mixpanel is an event-based product and web analytics platform that helps teams understand how users interact with websites, mobile apps, and features in real time. It focuses on self-serve analysis, so product, marketing, and data teams can answer questions without SQL.
Key features of Mixpanel
- Event-based tracking across web, mobile, and backend events
- Prebuilt reports for funnels, retention, flows, cohorts, and attribution
- Metric Trees to connect product metrics to business outcomes
- Session Replay to watch real user sessions alongside quantitative data
- Warehouse connectors to sync trusted data from BigQuery, Snowflake, etc.
- Behavioral cohorts and real-time se
Pros And Cons of Mixpanel
Mixpanel Is Best for
Product-led and growth-focused teams that want powerful behavior analytics and experimentation, including eCommerce businesses that already have revenue and margin reporting and now need clearer insight into how users move through journeys, features, and checkout flows.
Mixpanel’s Pricing
Mixpanel offers different kinds of pricing based on different tiers:
- Free: Up to 1M monthly events, 5 saved reports, 10K session replays
- Growth: First 1M events free, then from ~$0.28 per 1K events, unlimited reports, 20K+ replays, cohorts and more
- Enterprise: Custom pricing, unlimited events, advanced governance, SSO, longer retention, premium support
4. Kissmetrics
Kissmetrics is a marketing and product analytics tool that helps eCommerce and SaaS businesses track user behavior, funnels, and customer journeys. It segments audiences based on actions such as purchases, engagement frequency, or funnel stage, giving marketers a clear picture of how customers interact across touchpoints.
Key Features of Kissmetrics
- Behavioral Cohorts: Analyze groups of users based on activity over time.
- Funnel Analysis: Identify where users drop off and optimize conversion steps.
- Revenue Tracking: Connect marketing performance to actual revenue.
- Integrations: Works with email, ad, and analytics tools for campaign tracking.
Pros and Cons of Kissmetrics
Kissmetrics Is Best for
- Ecommerce and SaaS teams that want funnel-based segmentation tied to user actions
- Marketing teams focused on conversion optimization and retention analysis
- Businesses that need to connect campaign performance to revenue outcomes
- Teams looking for behavioral insights across email, ads, and on-site interactions without heavy data modeling
Kissmetrics’s Pricing
Kissmetrics offers custom pricing based on monthly tracked users (MTUs) and data needs. Plans typically start around $25/month, with advanced analytics and unlimited event tracking available for enterprise customers on request.
5. Woopra
Woopra is a customer journey analytics platform that unifies data across product, marketing, sales, and support into a single timeline-style view. It focuses on tracking every user action, mapping end-to-end journeys, and triggering real-time automations based on behavior.
Key Features of Woopra
- End-to-end journey analytics covering journeys, trends, cohorts, retention, and attribution
- Real-time people profiles showing every event and property change per user
- Built-in automations to trigger emails, Slack alerts, or CRM updates based on behavior
- 30+ one-click integrations plus Data Loader for syncing data from databases and SaaS tools
- Visual, no-SQL interface for funnel and journey exploration by non-technical teams
Pros and Cons of Woopra
Woopra Is Best for
- Product-led and SaaS businesses that need deep customer journey visibility
- Subscription businesses focused on behavior-driven engagement and retention
- Teams that want real-time analytics tightly connected to automated actions
- Ecommerce teams that care more about journey analysis than detailed profitability modeling
Woopra’s Pricing
- Core (Free): Up to 10,000 actions per month, 30-day data retention, 1 user
- Starter: From $49+/month, 50K+ actions, 1-year retention, up to 5 users
- Pro: From $999+/month, ~5M+ actions, 2-year retention, up to 50 users, advanced analytics and automations
- Enterprise: Custom pricing for 50M+ actions, up to 3-year retention, SSO, governance, and warehouse sync
6. Fullstory
FullStory is a digital experience and behavioral analytics platform focused on capturing how users interact with websites and mobile apps. It specializes in always-on behavioral data collection, session replay, and AI-assisted analysis to help teams identify friction, usability issues, and broken journeys. FullStory is widely used by product, UX, and support teams to understand how experiences fail, rather than to model revenue or lifecycle performance.
Key Features of Fullstory
- Autocapture and session replay: Records user interactions automatically without manual event tagging
- Heatmaps and rage-click detection: Surfaces frustration signals and interaction issues
- Journey and funnel analysis: Visualizes paths users take across pages and key actions
- StoryAI and Fullcapture: AI-assisted analysis built on complete behavioral datasets
Pros and Cons of FullStory
FullStory Is Best for
- Product and UX teams diagnosing usability issues and broken flows
- Support teams that need full session context to resolve issues faster
- Organizations focused on improving digital experience quality
- Teams prioritizing qualitative behavior insight over revenue intelligence
Fullstory’s Pricing
FullStory offers multiple plans across Analytics, Workforce, and Anywhere products. Pricing is tiered by usage, features, and data retention, with Free, Business, Advanced, and Enterprise options available. Detailed pricing is provided on request based on session volume and requirements.
7. Amplitude Personas
Amplitude Personas is a customer segmentation tool built to help SaaS and digital product teams understand user behavior in depth. It segments users based on engagement patterns, product usage, and conversion paths, making it easier to identify high-value audiences and refine retention strategies.
Key Features of Amplitude Personas
- Behavioral Cohorts: Create segments based on specific in-app actions and habits.
- Journey Analytics: Visualize how user groups move across product stages.
- Predictive Audiences: Identify users most likely to convert or churn.
- Feature Experimentation: Test new features and evaluate performance impact in real time.
Pros and Cons of Amplitude Personas
Amplitude Personas’ Pricing
Amplitude offers a Starter plan (Free) with 50K MTUs and up to 10M events. The Plus plan starts at $49/month (billed annually) with behavioral cohorts and segmentation tools. Growth and Enterprise plans are custom-priced, including advanced experimentation, predictive audiences, and dedicated account management.
8. Microsoft Clarity
Microsoft Clarity is a free user behavior analytics tool focused on helping teams understand how visitors interact with websites and mobile apps. It captures visual and interaction-based signals such as clicks, scrolls, and session recordings, making it easier to spot usability issues, friction points, and engagement patterns.
Key Features of Microsoft Clarity
- Session recordings: Always-on recordings to see how users navigate pages and flows
- Heatmaps: Click, scroll, area, and conversion heatmaps generated automatically
- Rage click and dead click detection: Highlights frustration signals and broken interactions
- Smart insights and Copilot summaries: AI-assisted session and heatmap summaries
Pros and Cons of Microsoft Clarity
Microsoft Clarity Is Best for
- Small to mid-sized teams looking for a free UX and behavior analytics tool
- Product, UX, and marketing teams diagnosing usability issues and page friction
- Businesses that want visual behavior insights without cost or setup complexity
- Teams using Clarity alongside Google Analytics or other analytics platforms
Microsoft Clarity’s Pricing
Microsoft Clarity is 100% free, with no limits on traffic, sessions, heatmaps, or team members. There are no paid plans.
9. GA4
Google Analytics 4 (GA4) is Google’s event-based analytics platform designed to track website and app behavior within a single property. It helps ecommerce teams understand traffic sources, engagement, conversions, and how users move through funnels. GA4 integrates directly with Google Ads, making it a common choice for acquisition measurement and media optimization.
Key Features of Google Analytics
- Event-based tracking for all user interactions
- Unified web and app measurement in a single property
- Predictive metrics such as purchase probability
- Privacy-ready measurement with cookieless modeling
Pros and Cons of Google Analytics
Google Analytics Is Best for
- Teams that need a free, baseline behavioral analytics layer
- Marketers tracking acquisition performance and on-site funnels
- Businesses heavily invested in the Google Ads ecosystem
- Organizations that plan to supplement GA4 with a dedicated ecommerce analytics platform for retention, product performance, and revenue insights
Google Analytics’ Pricing
- Standard GA4: Free
- GA4 360: Custom enterprise pricing
10. Heap
Heap is a digital insights and product analytics platform designed to help teams understand end-to-end customer journeys across websites and apps. It automatically captures every user interaction without manual event setup and combines quantitative analytics with qualitative context such as session replay.
Key Features of Heap
- Automatic data capture: A single snippet captures all user interactions across web and app experiences
- Funnel, journey, and retention analysis: Analyze how users move through flows and where friction appears
- Heap Illuminate: Data science–driven insights that surface key moments of opportunity or drop-off
- Session replay (add-on): Watch full sessions to understand context behind user actions
Pros and Cons of Heap
Heap Is Best for
- Product-led and SaaS teams that want fast insight without heavy tracking setup
- Growth and product teams optimizing funnels, activation, and retention
- Organizations that value automatic data capture and behavioral analysis
- Ecommerce teams focused on journey optimization rather than deep financial analytics
Heap’s Pricing
- Free: Up to 10,000 monthly sessions with core analytics and 6 months of data history
- Growth: Paid plan with expanded features, users, and 12 months of data history
- Pro and Premier: Custom pricing based on session volume, advanced analytics, warehouse integration, and governance needs
Core Capabilities to Look for in Customer Behavior Analysis Tools
Evaluation should focus on capabilities that support decisions, not feature volume.
Unified customer profiles allow teams to connect behavior across sessions, channels, and devices. Behavioral segmentation should update dynamically as behavior changes, not rely on static rules. Funnel and cohort analysis should explain both conversion and retention performance.
Cross-channel attribution visibility helps teams understand how behavior interacts across touchpoints. Predictive insights, such as churn risk or LTV forecasting, support earlier intervention. Activation support allows insights to sync with ads, email, or CRM systems. Dashboards should be usable by business teams, not only analysts.
Not all tools cover all capabilities. This is where meaningful differentiation appears.
Challenges Brands Face Without Proper Behavior Analysis
When customer behavior is not analyzed end to end, teams lose the ability to connect actions to outcomes. Data lives in separate tools, each telling part of the story but never the full picture.
Common challenges include:
- Siloed data across tools: Marketing, product, and finance teams work from different dashboards, making it hard to align behavior with revenue, retention, or margin impact.
- Over-reliance on last-click attribution: Early intent signals and assistive touchpoints are ignored, leading teams to overvalue final interactions and misallocate spend.
- Static, outdated customer segments: Segments do not update as behavior changes, so targeting and personalization fall out of sync with real customer intent.
- Insights trapped in dashboards: Reports highlight problems but do not connect to activation in ads, email, CRM, or product workflows.
- Manual reporting slows decisions: Analysts spend time pulling data instead of testing ideas, limiting speed, experimentation, and learning.
Over time, teams optimize what is easiest to measure, not what actually drives conversion, retention, and lifetime value.
How to Choose the Right Customer Behavior Analysis Tool
Step 1: Start With the Decisions You Need to Make
Before comparing tools, get clear on what you want to improve. Behavior analysis should answer business questions, not just produce reports.
- Are you trying to improve conversion, retention, or LTV
- Do you need to understand intent, friction, or drop-offs
If a tool cannot support these decisions, more data will not help.
Step 2: Decide on Real-Time vs Historical Insight
Different teams need different time horizons. Many tools specialize in only one.
- Real-time insights support personalization, alerts, and rapid testing
- Historical analysis supports cohorts, trends, and planning
Growing ecommerce teams usually need access to both.
Step 3: Check Whether Data Can Be Unified Across Channels
Customer behavior spans ads, email, site activity, checkout, and repeat purchases. Fragmented data leads to incomplete insight.
- Can the tool connect marketing, product, and commerce data
- Does it rely on multiple disconnected dashboards
Unified data is essential for reliable analysis.
Step 4: Confirm Behavior Connects to Revenue Outcomes
Event tracking alone does not explain business impact. Behavior analysis should link actions to results.
- Can you tie behavior to retention, LTV, and payback
- Does the tool move beyond clicks and sessions
Without this, teams optimize activity instead of growth.
Step 5: Evaluate Segmentation and Activation Together
Segmentation only matters if it stays current and can be acted on.
- Do segments update automatically as behavior changes
- Can insights flow into ads, email, CRM, or product tools
Static segments and manual exports slow teams down.
Step 6: Assess Usability, Governance, and Cost at Scale
Adoption, trust, and predictability matter as teams grow.
- Can non-technical teams use the tool without constant analyst support
- Are metric definitions shared and governed across teams
- Does pricing scale predictably with traffic and data volume
Tools that fail here often create friction over time.
Why Growing Ecommerce Businesses Choose Saras Pulse for Customer Behavior Analysis
Understanding customer behavior is foundational to profitable growth. Teams need clear visibility into how behavior influences revenue, retention, and lifetime value.
Saras Pulse supports this by unifying behavioral, marketing, and transaction data into a single decision layer. Instead of fragmented dashboards, teams get shared metrics, cohort-level insight, and role-specific views that align growth, marketing, finance, and operations around the same customer reality.
For ecommerce teams evaluating customer behavior analysis tools, Saras Pulse provides a practical path from insight to action without relying on disconnected analytics or static reporting.
If you want to see how unified customer behavior insight supports day-to-day decisions, you can explore Saras Pulse in more detail through a product demo.

.svg)
.png)
%201%20(1).svg)


.png)


.png)


.png)


.png)


.png)


.png)


.webp)


.avif)


.avif)

.avif)
.avif)
.avif)
.avif)
%20(1).avif)
.avif)
%20(1).avif)
%20(1).avif)


