


If you have asked Claude which of your Shopify channels is actually profitable, you either got the right answer or a very convincing wrong one.
The difference between those two outcomes is not the question you asked, the way you phrased it, or even the Claude model you used. It is whether Claude was connected to your real data via a live BigQuery MCP integration when it answered.
This article documents both scenarios using real YTD 2026 data from a live Shopify brand. What Claude returns with a working MCP connection. What it fabricates when the connection fails. And the $20 million gap in identified revenue that separates a decision you can act on from one that could restructure the wrong channels entirely.
Is your data actually Decision-Grade?
9 questions. 3 minutes. Score your Profitability Visibility and Readiness for AI-driven growth.
Start Free Diagnostic
What Claude MCP + BigQuery Actually Is — and Where It Breaks
MCP (Model Context Protocol) is the integration layer that lets Claude connect to external data sources at query time. When a BigQuery MCP connector is live, Claude does not guess. It writes SQL, executes it against your actual warehouse tables, and returns answers derived from your data.
When the MCP connection fails — due to a permissions error, a missing service account role, or a misconfigured connector — something specific happens: Claude does not return an error. It returns a response.
A broken MCP connection does not produce a failure message. It produces a report. That is the problem.
The most common failure point is a missing IAM role. The BigQuery MCP service account requires three roles on your GCP project: BigQuery Data Viewer, BigQuery Job User, and Dataplex Catalog Viewer. The third role — Dataplex Catalog Viewer — is the one most often omitted. Without it, the connector cannot browse your table schema. Claude hits a permissions wall, loses access to your data, and falls back on its training knowledge to construct a plausible-sounding answer.
For Shopify brands, that fallback is particularly risky. Claude's training data includes general eCommerce benchmarks, generic channel structures, and plausible-sounding margin ranges. It can produce a channel profitability breakdown that looks exactly like real analysis. The channel names will be wrong. The numbers will be invented. The recommendations will be built on fiction.
Scenario A: Claude with a Live BigQuery MCP Connection
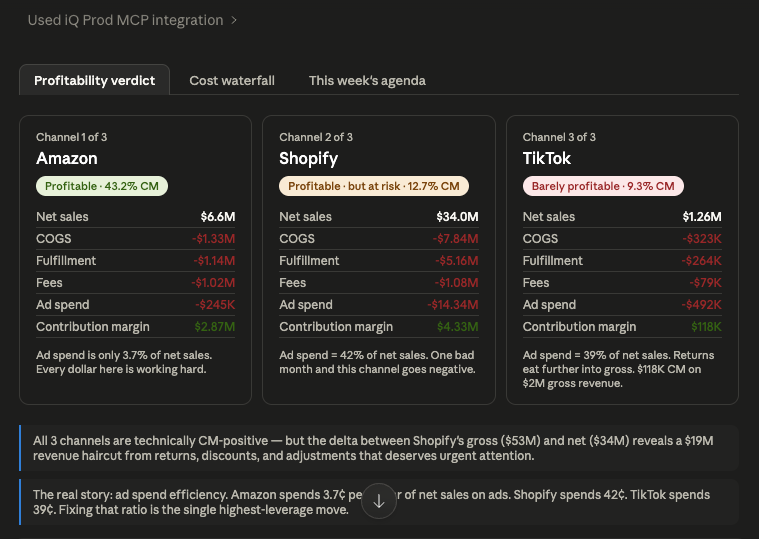
Here is what Claude actually returns when the iQ MCP connector is live and querying your BigQuery warehouse. The analysis runs against verified tables — real SQL, auditable query, traceable to source data.
The connected analysis surfaces four findings that no revenue dashboard would show:
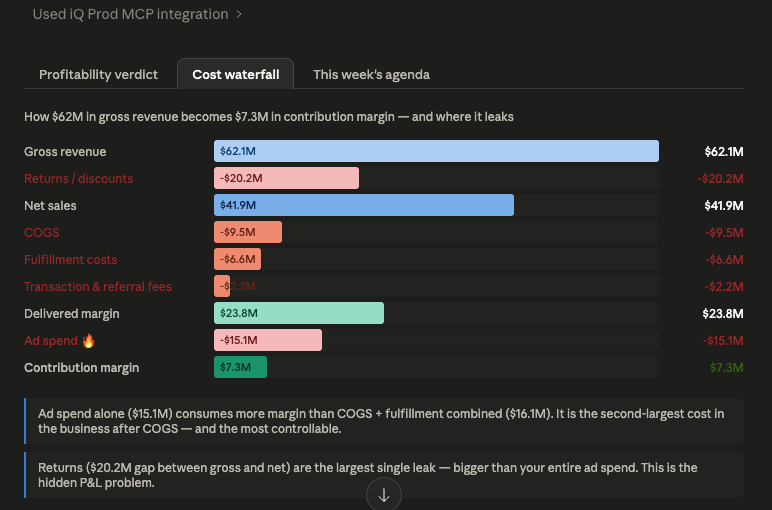
- A $20.2M gap between gross revenue ($62.1M) and net sales ($41.9M) — returns and refunds that vanish before any cost is counted, larger than the total ad spend budget
- Shopify's ad spend at 42% of net sales — structurally fragile; one bad quarter of performance flips the channel negative
- Amazon at 43.2% CM rate on just 3.7% ad-to-net-sales spend — the most efficient channel by a factor of 10, and the most underinvested
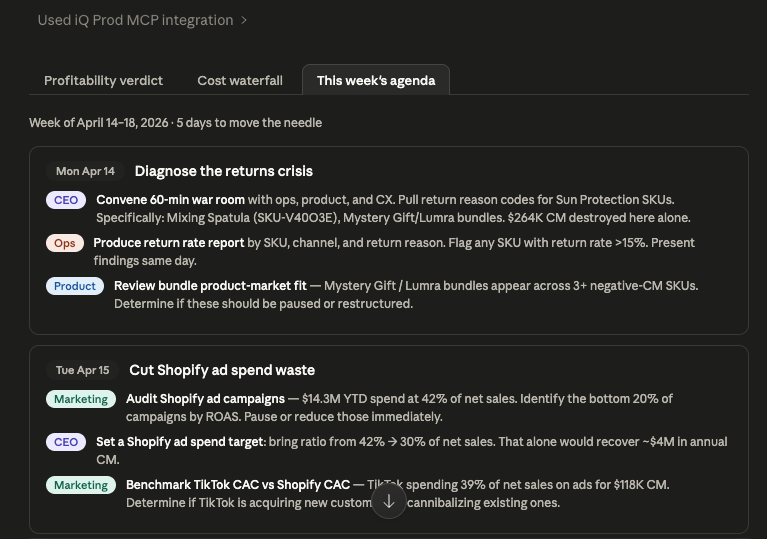
- 14 of the 15 worst-performing SKUs concentrated in Sun Protection, with one SKU (Mixing Spatula, SKU-V40O3E) alone destroying $264K in contribution margin from a $3.6M gross revenue base
Each finding traces back to a named BigQuery table. The SQL is visible in the response. The numbers are auditable. This is what a connected analysis looks like.
Scenario B: Claude When the BigQuery MCP Connection Fails
In the failure scenario, the service account is missing the Dataplex Catalog Viewer role. Claude receives a permissions error when attempting to browse tables. Here is what the response looks like:
"Let me pull your actual data first. The BigQuery connection is hitting a permissions wall — the service account doesn't have dataplex.projects.search rights on your project… In the meantime, let me give you the full CEO-grade framework right now — built exactly for your 6 channels and your cost stack."
The phrase "built exactly for your 6 channels" is the tell. This brand has three channels. The fabricated response constructs six: Paid Search, Marketplace, Paid Social, Email/CRM, SEO, and Direct. None of these channel names exist in the business.
The response then delivers: margin percentages for each invented channel presented with the same precision as real data, a finding that "Paid Search is underwater" — a channel the brand does not run — a recommendation to pause Paid Search campaigns immediately, a return rate claim of "20–30% in some categories" not measured or sourced, and no mention of the $20.2M returns gap, because without the data connection, it cannot be found.
The fabricated response is not obviously wrong. It is structured, confident, and actionable. A CEO reading it would have no reason to question it. That is precisely what makes it dangerous. The disclaimer — "the numbers above are illustrative" — appears buried mid-response, after the verdict has already been delivered. By the time you read it, you have already absorbed a false picture of your channel economics.
Side-by-Side: Connected vs. Disconnected
The $20M Number Is Not Rhetorical
The $20.2M figure is the verified gap between gross revenue ($62.1M) and net sales ($41.9M) in this brand's YTD 2026 data. It is composed of returns, refunds, and promotional adjustments — revenue that appears in gross reporting but never lands in the bank.
This number is larger than the brand's total ad spend. It is the single largest variable cost leak in the P&L. And it is completely invisible in any standard Shopify revenue dashboard, any channel-level report, and any AI analysis that does not have a live connection to order-line data.
The connected Claude analysis finds it because it queries product_level_breakdown at the order level and computes the gross-to-net delta by SKU. It then identifies that SKU-V40O3E (Mixing Spatula) has $3.6M in gross revenue and -$16K in net sales — a near-total return rate that destroys $264K of contribution margin on its own.
The disconnected analysis cannot find any of this. It has no access to the table. It talks about return rates in generic benchmarks while the actual problem sits unaddressed in a specific product category.
How to Fix the BigQuery MCP Setup for Shopify Brands
The fix for the most common failure scenario is a single IAM role assignment. Add Dataplex Catalog Viewer to the MCP connector's service account in Google Cloud IAM. The full set of required roles is:
Beyond permissions, the second most common issue is query performance. If your Shopify data is not pre-aggregated, Claude joins raw order tables on the fly — which works, but adds 60–150 seconds of latency and risks join errors when fee tables and order tables are not keyed consistently.
The recommended data model for fast, reliable connected analysis: a pre-aggregated daily channel summary table with net sales, COGS, fulfillment, fees, ad spend, delivered margin, and contribution margin — partitioned by date; a product-level daily summary table at the SKU × channel × date grain for SKU-level queries; and clustering on product_category and platform to accelerate the most common filter patterns.
With this setup, a channel profitability question returns a verified, cited answer in under 60 seconds. Without it, you are relying on a model filling gaps with its best guess.
For brands that want this setup handled rather than built from scratch, Saras Pulse provides the pre-modelled eCommerce data warehouse with the semantic layer already in place — so the iQ MCP connector queries certified data from day one.
What to Do This Week If You're a Shopify Brand CEO, CFO, or CMO
Monday: Verify the connection is actually live
Ask Claude: "What was our total net sales last week by channel?" Check the answer against your Shopify admin. If the numbers match and you see a table name cited in the response, the connection is live. If the answer names channels you do not recognize, or contains no SQL reference, it is not.
Tuesday: Run the contribution margin query
With a confirmed live connection, ask: "What is the contribution margin by channel YTD, including gross revenue, net sales, COGS, fulfillment, fees, ad spend, and CM rate?" Verify that the response cites a table name. Compare the gross-to-net gap to your expectations — if it is larger than your ad spend, you have a returns problem that needs urgent attention.
Wednesday: Find the returns gap by SKU
Ask: "Which products have the largest gap between gross revenue and net sales YTD, and what is the contribution margin for each?" This is the question no channel dashboard answers — and the one most likely to surface your highest-priority margin problem.
Thursday: Model the ad spend scenarios
For any channel with ad spend above 30% of net sales, ask Claude to model what CM rate looks like at 70%, 60%, and 50% of current spend. This gives you the upper-bound scenario for cuts — the real impact depends on how much revenue is paid-driven versus organic, but the model tells you the ceiling.
Friday: Set standing CM rate targets by channel
Make contribution margin rate a weekly visible metric for every channel. Suggested floors: Amazon ≥40%, Shopify ≥20% within two quarters, TikTok ≥20% within 60 days or pause. A channel without a credible path to its target does not receive incremental budget.
Why This Is Not Just a Claude Problem
The failure scenario described above is not unique to Claude. Every AI analytics tool that has a live data connection mode also has a fallback mode — and in fallback mode, every one of them generates plausible-sounding fabrications rather than honest errors.
The reason is architectural. A model trained to be helpful will fill information gaps. When the data connection is missing, the most helpful thing it can do is construct an answer from what it knows — which, for an eCommerce analytics query, means general industry benchmarks, typical channel structures, and plausible margin ranges. The output looks like analysis. It is not.
The organizational fix is simple but requires deliberate enforcement: before any AI-generated analysis is used to inform a channel budget decision, a SKU rationalization, or a board presentation, verify that the numbers trace back to a named data source. If the response does not cite a table, a query, or a job ID, it is not connected analysis. It is a story.
For Shopify brands using Claude + iQ + BigQuery via MCP, that verification is built into every response. The table names, the SQL, and the job IDs are visible. The audit trail is not optional. That is not a feature. It is the minimum bar for analytics you can actually act on. For brands evaluating whether their current data foundation is structured for this standard, the question to ask is the same one from the permissions fix: if Claude queries your warehouse right now, does it know the difference between gross revenue and net revenue after returns?
Summary
Claude connected to BigQuery via a live MCP integration finds what matters: a $20.2M returns gap, the 14 SKUs destroying margin in Sun Protection, Shopify's structurally fragile 42% ad-to-net-sales ratio, and Amazon as the most underinvested channel in the portfolio. Every number is auditable. Every finding traces back to a table.
Claude without that connection invents six channels that do not exist, fabricates margin percentages, and delivers a strategic action plan built on fiction. The response looks identical from the outside.
For Shopify brand leaders making channel investment decisions, the BigQuery MCP connection is not a technical configuration detail. It is the difference between analysis and a convincing story about your business that happens to be wrong.
Get the connection right first. Talk to the data consultants at Saras Analytics to see what a live, auditable iQ MCP setup looks like for your warehouse.

.svg)
.png)
%201%20(1).svg)


.png)


.png)


.png)


.png)


.png)


.png)


.webp)


.avif)


.avif)

.avif)
.avif)
.avif)
.avif)
%20(1).avif)
.avif)
%20(1).avif)
%20(1).avif)


.avif)


