.webp)
Ask a founder how last quarter's biggest promotion performed and you will get a revenue number. Ask how that same promotion changed contribution margin, repeat purchase behavior, and the cash tied up in the inventory it moved, and the room goes quiet. That gap is what eCommerce analytics for founders is really about.
Do you think the problem is a shortage of data? Certainly not. The thing is that every major growth decision gets judged on the number that is easiest to see, while its effects on everything else stay invisible. A promotion, a new channel, a retention push, each is priced against the same margin, cohort, and cash pool, yet most leaders read them on separate screens.
DTC founders who scale on purpose run those bets against one trusted view of the economics they share. This article breaks down how those decisions connect, and the questions that expose the connections before you commit.
What Happens When you Make Business Decisions in Isolation?
The real cost of deciding in isolation is the damage you often don’t see coming. In such cases, a move that helps one part of the business quietly hurts another somewhere you were not watching. Growth multiplies that risk. Every new channel, promotion, cohort, and retention program adds another moving part. Native platform dashboards were built to answer one narrow question at a time, not to show how the answers push on each other.
Blended Numbers Hide the Losers
What follows is local optimization. Each team improves the metric it owns. The promo lifts revenue, the new channel adds orders, the loyalty program nudges repeat rate, and nobody sees what those wins quietly changed downstream. Blended numbers make the blind spot worse. Overall contribution margin can read healthy while a channel, a country, or a discounted cohort inside it loses money, covered by the 80 percent that is working.
Distrusted Data Slows Every Decision
The cost also shows up as speed. When the data cannot referee a disagreement, the call defaults to the most senior or most confident voice in the room rather than the most accurate one, and the same argument resurfaces the following week because nothing was ever settled. That distrust is now the norm rather than the exception.
In Precisely and Drexel University's 2025 Data Integrity Trends and Insights report, 67 percent of data and analytics professionals said they do not completely trust their organization's data for decision-making, up from 55 percent a year earlier. A founder who cannot trust the number cannot move quickly on it, so the decision either slips or gets made on instinct.
Three Growth Decisions That are More Connected Than They Look
The clearest way to see the interconnection is to follow three decisions founders make constantly, and trace what each one moves besides the metric it targets.
1. Promotions: Revenue Lift vs Margin and Customer Behavior
A promotion is the easiest decision to declare a win, because the revenue lift is immediate and visible. What it changes underneath is neither. A sitewide discount does not just trade margin for volume; it changes who walks in the door. A buyer acquired on a 40 percent holiday offer often behaves like a discount shopper, stocking up once and repurchasing at a lower rate than someone who converted at full price.
Returns quietly widen the gap. The National Retail Federation put 2024 US returns at 16.9 percent of sales, roughly $890 billion, with online return rates running higher than the overall average.
With acquisition costs climbing across the board, the question that should be asked is what the promo did to contribution margin and to the lifetime value of the customers it brought in.
2. Channel Expansion: More Revenue vs a Different Margin Profile
A new channel adds a second economics engine, not just a second revenue line. Marketplace fees, fulfillment path, return rates, and customer quality all differ from the direct-to-consumer store, and often the product itself does too. Brands routinely sell a cheaper spec or a different pack on a marketplace than on their own site, so blended margin can slide even as the top line grows.
The channel that shows the best conversion is not always the one generating the most contribution dollars. If you choose conversion alone, you push spend toward volume that does not carry profit. A channel's ranking also flips depending on which attribution model you believe, so that debate never really resolves. Contribution margin is the one read that does not move on you. Attribution is a guess. Profit is a fact.
3. Retention Changes: Repeat Revenue vs Broader Unit Economics
Retention is where the connections get counterintuitive. The headline returning-customer rate often moves with how hard you are acquiring, not with loyalty. Spend less in a slow month and the returning share jumps, spend hard and it drops, even when nothing about the actual customer experience changed. Read on its own, that number will mislead you.
Timing hides the rest. For a subscription brand, a price increase in March can surface as a churn spike in June, when 90-day repurchase cycles come due, so the cost of the decision lands a full quarter after the decision was made. Even a retention win has a downstream bill. Serving repeat buyers with constant newness can drive up the SKU count and the inventory cash locked inside it, which is a profitability problem wearing a loyalty costume.
The connection runs upstream too. A slowdown in new-customer acquisition quietly thins the retention base months before it shows up as a churn number, because the cohorts that would have carried next quarter's repeat revenue were never acquired in the first place. The operators who stay ahead of this watch which customers are drifting toward lapsing this month and step in before the churn compounds, instead of reading a retention rate after the fact and reacting to it.
What eCommerce Leaders Measure Before Making a Growth Decision
Before a major move, strong DTC operators check it against true economics rather than top-line revenue, which means looking at contribution margin, customer lifetime value, repeat revenue, and the cash timing of the decision together. The discipline is simple to state. Judge a decision by what it does to the profit you keep and the customers you build, not the revenue it prints on day one.
Margin is Not One Number
Margin is not a single figure, and treating it like one is how teams end up talking past each other. CM1 strips product cost, CM2 strips fulfillment and fees, CM3 strips acquisition spend, so a move can lift CM1 while CM3 quietly falls. When the CFO cites one margin, Growth optimizes against another, and Ops reconciles a third, all three are working from a different definition of the same word. The discipline is agreeing which layer a given decision gets judged on before the decision is made.
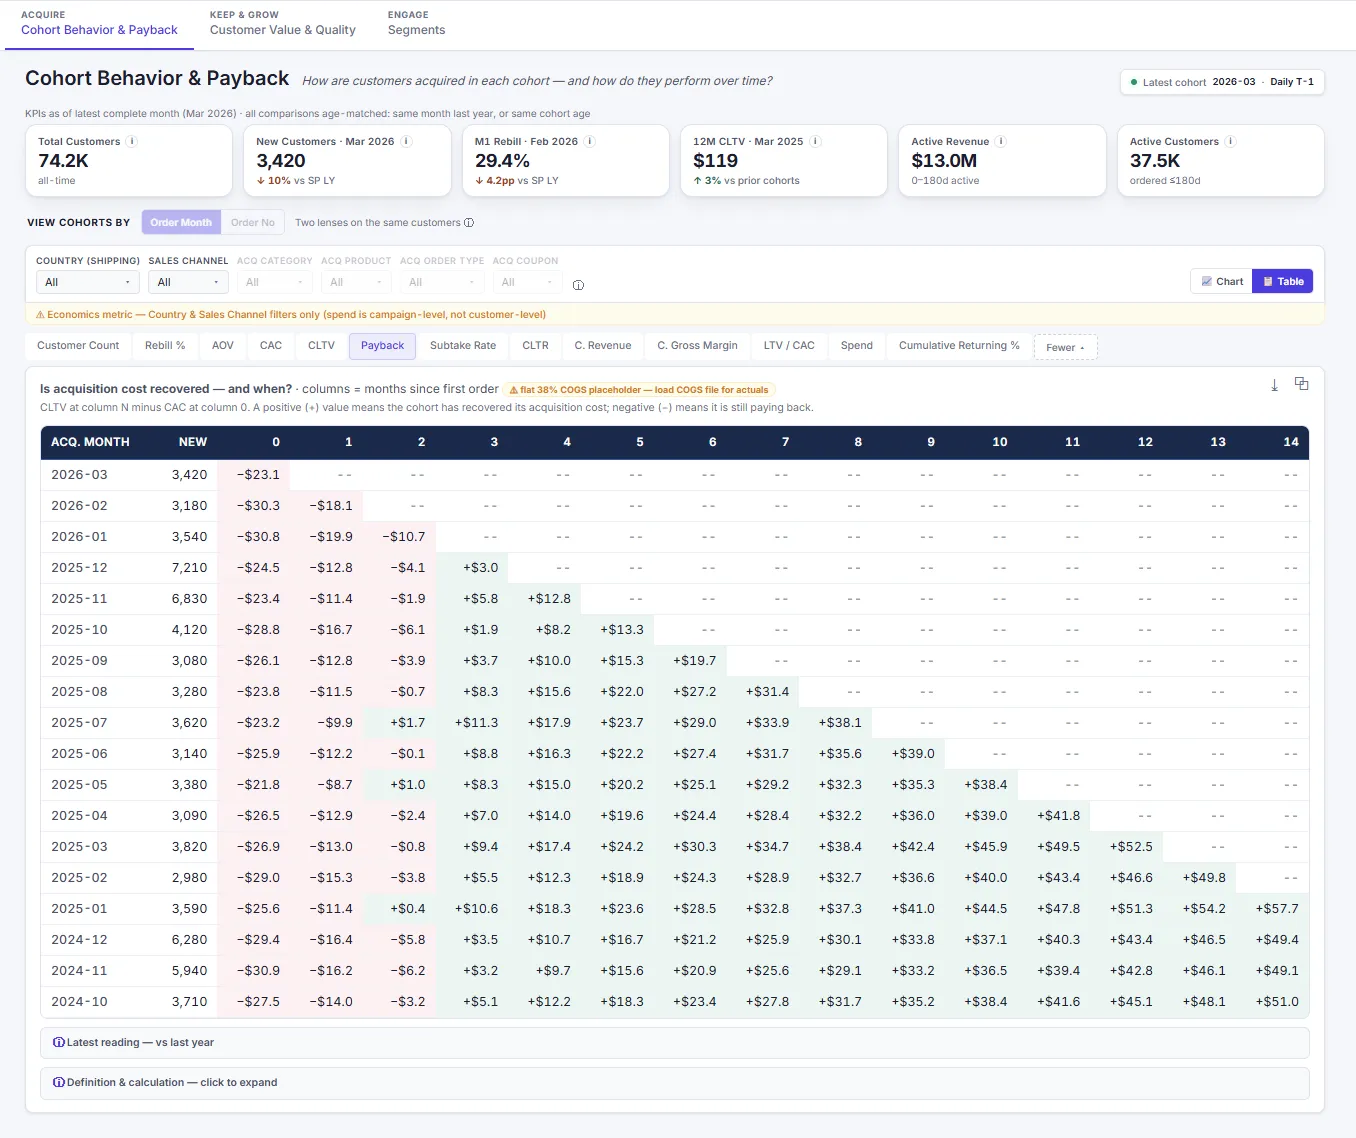
Lifetime value hides the same trap. Measured in revenue, every cohort looks healthy. Measured in margin from the acquisition date forward, net of the cost to win that customer, the weak cohorts show themselves. Tracking margin-based LTV rather than the revenue version is one of the clearest lines between operators who scale profitably and those who scale into trouble.
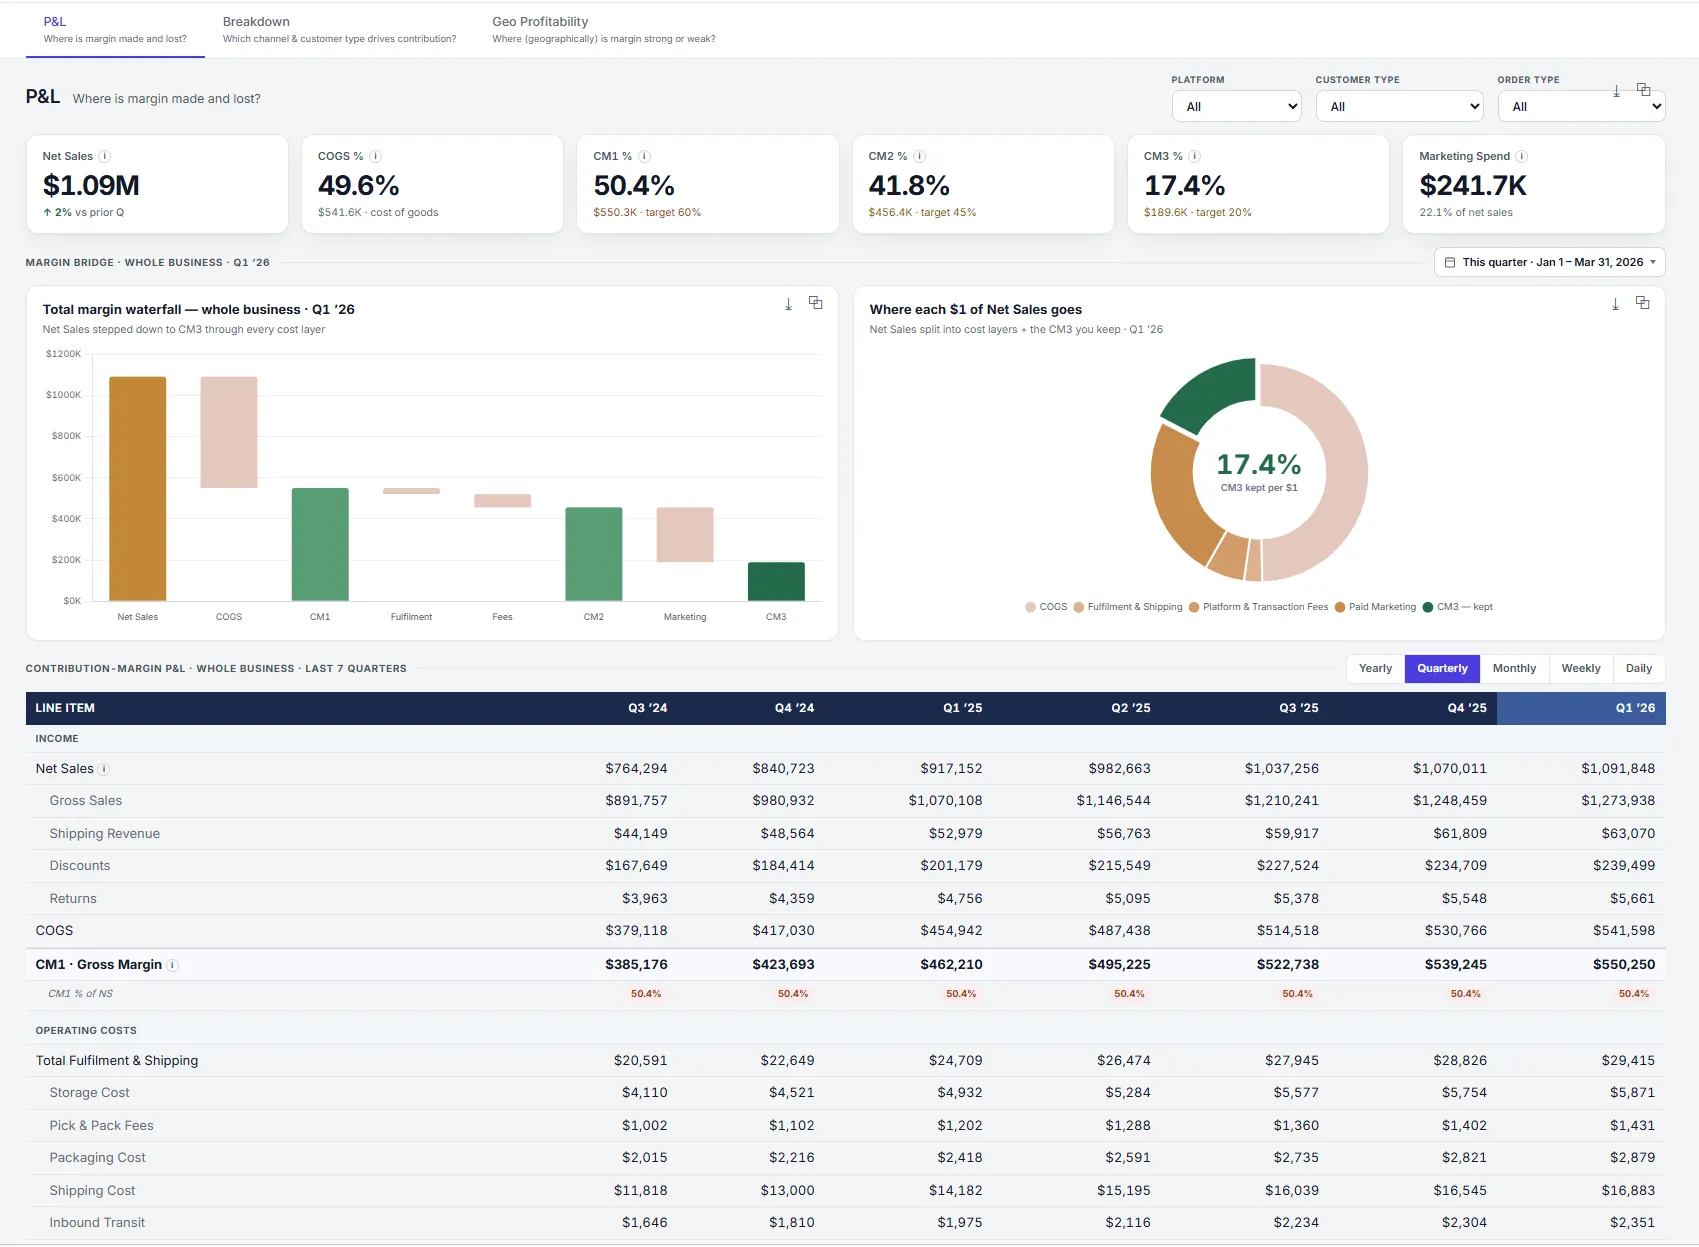
Note: the dashboards shown here illustrate the kind of connected visibility this article describes. They are examples of what the economics look like when unified, not an output the prompts later in this article generate.
Trusted data beats a heavier reporting stack
This is what mature eCommerce analytics looks like, and none of it requires a founder to build a heavier reporting stack. It requires trusted data and the habit of asking questions that connect outcomes. Faherty reached this point by unifying customer, order, marketing, carrier, and warehouse data into one foundation, then running decisions against it across carrier strategy, inventory, CX staffing, and planning.
A lack of data is not the constraint here. It is more about making high-confidence calls fast enough, and the connected view drove $1.1M in incremental revenue from segment-led campaigns alone. Read the full case study →
What this looks like day to day is a standing weekly review where each promo, channel shift, or retention test is read against margin and cohort movement in the same view, so its trade-offs are on the table when the next one is being decided.
The Questions Founders Should Ask Their Data
The fastest way to expose how decisions connect is to ask better questions of the data you already have, before adding any new tool. Most founders already hold the data that answers the questions worth asking. What they lack is the habit of asking in a connected way, tracing one decision across margin, cohort, and cash instead of pulling each metric on its own.
The questions worth asking sound less like reporting requests and more like decisions put under a microscope. A few that consistently surface hidden connections:
- How did this promotion change contribution margin and repeat behavior, beyond the immediate sales lift?
- Which channels create the strongest long-term customer value after all fees, fulfillment, and returns are counted, rather than just the highest revenue?
- How does a change in retention move repeat revenue, customer lifetime value, and cash flow together over the next two quarters?
Ground the Questions in Trusted Data
These are structured prompts you can put to Claude or your preferred LLM directly against your existing business data, with no new implementation and no waiting on a reporting cycle. The catch is that the answer is only as trustworthy as the data underneath it. An AI asked to reason over conflicting exports will answer with confidence and still be wrong, which is worse than no answer at all. Grounding the same questions in a single, governed set of numbers is what turns a plausible response into one a founder can act on.
Connected Decisions Replace Isolated Metrics
Connected decisions replace isolated metrics by putting acquisition, margin, and cohorts in one view. A leadership meeting then spends its hour deciding what to do about a promo, channel, or retention move rather than assembling the numbers, and the call gets made while it can still change the quarter.
The Right-sized Middle Ground
Once acquisition, retention, and margin sit in one view, the questions from the last section stop being research projects and become part of the weekly conversation. This is the middle ground a growing brand actually needs, past the native dashboards it has outgrown but short of an enterprise data build that takes a year and a team to stand up. SarasIQ Essentials sits in that gap, giving founders a trusted, connected view of contribution margin, cohorts, and channel economics without hiring a data team to maintain it.
When the data finally becomes actionable
Ridge had a solid data foundation, but decisions still waited on it until the same numbers became directly queryable.
%202.webp)
Decisions that once sat in a ten-day analyst queue now happen in the same meeting the question comes up. Read the full case study →
Conclusion
Growth decisions never happen in isolation, and the brands that scale profitably are the ones that can see how each promo, channel, and retention move changes the economics of the others. The AI Prompts Playbook from Saras Analytics collects the exact questions top operators ask their data to surface those connections before they commit, organized by role so founders can start with the ones built for them.

.webp)
.svg)
%201%20(1).svg)


%20Software%20for%20DTC%20Brands%20in%202026.png)










%20Setup%20Guide%20for%20Ecommerce%20Finance%20Team.png)




























.webp)
.webp)
.webp)
.webp)











.webp)





.webp)









.webp)







.png)