Customer acquisition cost (CAC) can look different depending on which costs are included. Platform ROAS may look healthy while actual profitability tells a different story. Advertising, fulfillment, and other variable costs can erode gross margin gains for Shopify brands doing $10M or more in annual revenue.
The fix is not another dashboard or a new attribution model. It is understanding customer lifetime value (LTV) by acquisition channel, the metric that reveals which channels actually bring profitable customers rather than one-time bargain hunters. Saras iQ's customer analytics gives Shopify brands a certified data foundation for analyzing channel-level LTV, helping them identify opportunities to reallocate 15 to 25% of ad spend from guesswork to known ROI.
Consider the gap: A July 2026 benchmark found that Google-acquired customers delivered $212 in one-year value compared to $97 for Meta. These figures are directional benchmarks across hundreds of brands, not guaranteed results. Measuring LTV by acquisition channel changes how brands evaluate acquisition investments beyond first-order ROAS.
Is your data actually Decision-Grade?
9 questions. 3 minutes. Score your Profitability Visibility and Readiness for AI-driven growth.
Start Free Diagnostic
Understanding LTV by Acquisition Channel: Beyond Basic Customer Lifetime Value
Standard LTV calculations tell you what an average customer is worth across your entire business. Channel-level LTV tells you which marketing investments actually generate profitable customer relationships, and which ones bring discount seekers who never return.
LTV by acquisition channel measures the average revenue a customer generates throughout their relationship with your brand, segmented by the marketing source that brought them in. This distinction matters because customer quality varies dramatically by channel:
- Email-acquired customers have the highest LTV of any channel, often 2x to 3x the average
- Organic search customers have LTV that is 20 to 40% higher than the overall average
- Paid social customers tend to have average or slightly below-average LTV
- Coupon and deal site customers consistently have the lowest LTV, often 40 to 60% below average
When your finance team calculates a single LTV number and your marketing team optimizes for platform ROAS, you miss this variance entirely. A channel delivering $30 CAC and 2x ROAS looks efficient until you realize those customers have half the repeat purchase rate of organic buyers.
Why Standard LTV Metrics Fall Short for Strategic Decisions
Aggregate LTV masks the customers destroying your margins. A $100 blended LTV might combine $250 email subscribers with $40 deal-site shoppers. Without channel segmentation, you cannot identify which acquisition investments to scale and which to cut.
The impact compounds over time. Customers acquired through organic search may generate higher lifetime value than those acquired through paid social, depending on the brand and customer cohort. Optimizing for volume rather than quality can mean building a customer base with lower retention, lower average order value (AOV), and higher support costs.
Calculating LTV by Acquisition Channel: Formulas and Key Data Points
Channel-level LTV requires granular data that Shopify brands may not have in their native dashboards. The calculation combines purchase behavior, margin contribution, and accurate channel attribution.
The Core LTV Formula
The basic formula multiplies three components:
LTV = Average Order Value × Purchase Frequency × Customer Lifespan
For channel-level analysis, you calculate each component separately by acquisition source:
- Channel AOV: What is the average order value for customers acquired through this channel?
- Channel Frequency: How many purchases do channel customers make over 12, 24, or 36 months?
- Channel Lifespan: How long do channel customers remain active before churning?
Essential Data Inputs for Accurate Channel LTV
Reliable channel-level LTV requires consistent definitions across your organization. Your CFO and CMO must agree on:
- Attribution window: How long after first touch does a channel get credit?
- Return handling: Are refunds subtracted at the order level or customer level?
- Cost allocation: Which marketing costs count toward channel CAC?
- Gross margin treatment: Do you measure revenue LTV or contribution margin LTV?
Shopify brands at $10M or more may encounter discrepancies because finance and marketing use different data sources. Marketing pulls from platform dashboards, finance pulls from the GL, and the numbers do not always reconcile. Inconsistent definitions and incomplete customer data also make it difficult to measure which channels bring customers worth retaining.
Customer Acquisition Cost by Channel in 2026
Acquisition costs vary significantly across channels, making channel-level ROI analysis critical. Industry benchmarks show meaningful differences in customer acquisition costs depending on the channel, business model, and costs included in the calculation. A 2025 ecommerce analysis cited an average ecommerce CAC of approximately $78, although actual costs vary by brand and methodology.
Channel-Specific CAC Benchmarks
Cost per acquisition varies dramatically by channel:
- Email marketing: Acquisition costs depend on campaign expenses, audience size, and the costs allocated to acquiring new customers.
- Facebook Ads: $18.68 average CPA across all industries
- TikTok Ads: CPA varies by campaign objective, audience, creative performance, and industry.
- Google Search: $70.11 average CPA across all industries in 2025
- Referral programs: CAC depends on referral incentives, program expenses, and the number of customers acquired.
These figures reveal why first-order metrics can deceive. Google may cost more than Meta per acquisition, yet the July 2026 benchmark showed Google-acquired customers generating 2.2x more one-year value. Whether the math favors Google depends on the actual acquisition costs and margins for each brand.
Beyond Platform ROAS: True CAC Across Channels
Platform-reported CAC can understate real costs when it excludes other acquisition expenses. Gartner's 2025 survey found that paid media accounted for 30.6% of total marketing budgets among surveyed marketing leaders.
The remaining budget covered other marketing activities and expenses, although not all were necessarily customer acquisition costs.
True CAC includes:
- Creative production costs
- Agency fees and management overhead
- Landing page development
- Attribution and analytics tooling
- Influencer and affiliate commissions
- Customer service for new buyer inquiries
When your CMO reports $50 CAC and your CFO reports $80, the gap often comes from differences in which costs each team includes. Building a single source of truth for CAC definition helps eliminate this disconnect.
Channel Performance Comparison: Where High-LTV Customers Actually Come From
Understanding relative channel performance helps Shopify brands allocate budget toward profitable customer acquisition rather than volume.
Email Marketing: The Highest-LTV Channel
Email-acquired customers can outperform other channels on lifetime value. They often deliver 2x to 3x average LTV, making email an important channel to evaluate alongside acquisition costs and customer retention.
Email can generate substantial returns for retail and ecommerce brands, particularly when campaigns reach engaged audiences. Measure the revenue and customer lifetime value attributable to email rather than relying on a universal revenue-share target.
Google Search and Shopping
Google-acquired customers had a one-year value of $212 compared to $97 for Meta in Wicked Reports' July 2026 benchmark. The comparison illustrates how channels can differ in customer value beyond the initial purchase.
This is why brands optimizing only for first-order metrics risk underinvesting in channels that attract high-value customers. The payback may take longer, but lifetime returns can justify the patience when supported by channel-specific data.
Meta Ads (Facebook and Instagram)
Meta can deliver acquisition volume, but customer quality should be evaluated against intent-driven channels. Meta's advertising costs fluctuate with competition, campaign objectives, audience targeting, and creative performance.
Meta customers tend to have average or slightly below-average LTV. The channel works for awareness and volume, but should not be the sole focus of acquisition strategy for brands prioritizing profitability.
TikTok Ads
TikTok shows promise for specific demographics but faces creative fatigue challenges. Maintaining performance can require frequent creative testing and refreshes as audience engagement and campaign results change.
The channel can deliver strong 90-day LTV ratios for brands with the creative velocity to sustain performance.
Deal Sites and Coupon Channels
Discount channels can deliver volume at the expense of customer quality. Deal site customers have LTV 40 to 60% below average, making them a potentially less profitable acquisition source.
If your marketing mix includes heavy coupon distribution, segment those customers separately in LTV analysis. Blending them with organic buyers distorts your understanding of true customer quality.
Marketing Attribution Challenges in a Privacy-First Environment
Accurate channel-level LTV requires accurate attribution, and attribution has become increasingly difficult following iOS privacy changes.
The Multi-Touch Reality
Online purchase journeys can involve multiple touchpoints. A customer might discover your brand through TikTok, research on Google, click a Meta retargeting ad, and convert through an email. Which channel gets credit for the LTV?
First-touch attribution overweights awareness channels. Last-touch attribution overweights conversion channels. Linear attribution spreads credit evenly but ignores influence variation. No model captures the full customer journey accurately.
Post-iOS Attribution Gaps
Apple's App Tracking Transparency framework requires apps to obtain permission before tracking users across other companies' apps and websites. When users decline, advertisers have less visibility into cross-app activity, creating attribution gaps.
Platform-reported conversions can diverge from actual revenue. Differences in attribution windows, reporting methods, and overlapping conversion credit make platform ROAS insufficient on its own for channel-level LTV calculations.
Why Certified Data Matters for Attribution Accuracy
The gap between platform-reported metrics and actual business outcomes requires a certified data foundation that reconciles discrepancies. This means:
- Order-level revenue matched to attributed channels
- Return and refund adjustments applied consistently
- Marketing spend unified across all platforms
- Timezone and currency standardized
Without this foundation, your channel-level LTV analysis inherits errors from every upstream data source.
Enhancing Customer Retention for Long-Term LTV Growth
Retention directly influences channel LTV. Small improvements in repeat purchase rates can compound into significant lifetime value gains.
The Second Purchase Threshold
Customers who make repeat purchases are more likely to continue buying. A customer who makes a second purchase is 3x more likely to make a third, and a customer who makes a third is 5x more likely to make a fourth.
This pattern means retention investment can generate substantial returns over time. Getting customers past the second purchase threshold is an important opportunity for LTV growth.
Channel-Specific Retention Patterns
Different acquisition channels produce different retention curves. High-intent channels (organic search, direct) may show higher second-purchase rates than interruption channels (paid social, display), depending on the brand and customer cohort.
Site performance can also influence the purchasing experience. Slow loading times and checkout friction may reduce conversions and repeat purchases, making website performance relevant to channel-level retention.
Loyalty Programs and LTV Impact
Well-designed loyalty programs can encourage repeat purchases and higher average order values among enrolled members. These improvements can increase channel LTV when they produce incremental customer spending.
However, poor post-purchase experiences can negate acquisition investments regardless of channel quality. Retention strategies should therefore address customer support, fulfillment, and product satisfaction alongside loyalty incentives.
Beyond ROAS: Connecting Return on Ad Spend to True Profitability
Return on ad spend (ROAS) measures revenue generated per dollar of advertising. It does not measure profit. A 3x ROAS channel might be unprofitable after product costs, fulfillment, and platform fees.
The Limitations of ROAS for Channel Assessment
ROAS ignores:
- Product margin variance: A 3x ROAS on 20% margin products can lose money after other variable costs.
- Return rates: Channels with high return rates inflate ROAS then reverse
- Fulfillment costs: Some channels drive larger orders with higher shipping expenses
- Payment processing fees: High-volume, low-AOV channels have worse fee ratios
A $100 order at 3x ROAS looks like $33 in efficient ad spend. But if that order has $50 COGS, $15 fulfillment, and $3 payment processing, the remaining contribution before other costs is negative after accounting for advertising spend.
Integrating Contribution Margin into Channel Decisions
Contribution margin subtracts variable costs from revenue to show actual profit contribution:
Contribution Margin = Net Sales - COGS - Fulfillment - Platform Fees - Variable Marketing
Channel-level contribution margin reveals which acquisition sources actually make money. A 2x ROAS channel with 60% margin products and 5% return rate might outperform a 4x ROAS channel with 30% margin products and 25% return rate.
Saras iQ's contribution margin analytics supports consistent calculations using governed cost and revenue definitions, helping finance and marketing evaluate profitability rather than revenue metrics alone.
Building a Single Source of Truth for Profitable Customer Acquisition
The gap between marketing's numbers and finance's numbers creates decision uncertainty. When your teams present three different LTV figures for the same channel, you cannot allocate budget with confidence.
The Cost of Fragmented Data
Fragmented reporting costs Shopify brands in multiple ways:
- Delayed decisions: Questions can take days to resolve when teams rely on manual reporting.
- Reconciliation overhead: Finance spends 40% of time reconciling numbers.
- Misallocated spend: Budget flows to channels with inflated metrics
- Board credibility gaps: Different numbers in different reports erode trust
Brands at $10M or more may have already tried solving this with BI tools, analysts, or point solutions. The problem can persist when the underlying data lacks governance.
How a Unified Data Foundation Enables Confident Decisions
A governed data foundation ensures:
- Single metric definitions: LTV, CAC, and contribution margin mean the same thing everywhere
- Consistent attribution: Channel credit follows defined rules, not platform defaults
- Validated accuracy: Numbers reconcile to the general ledger within defined tolerances
- Role-based access: Teams access governed metrics according to their permissions
For Shopify brands doing $10M to $50M, Saras iQ Essentials delivers this foundation with three certified use cases: contribution margin analytics, customer analytics with cohorts and segmentation, and sales and marketing analytics. Data refreshes nightly, and the full paid implementation goes live in about three weeks.
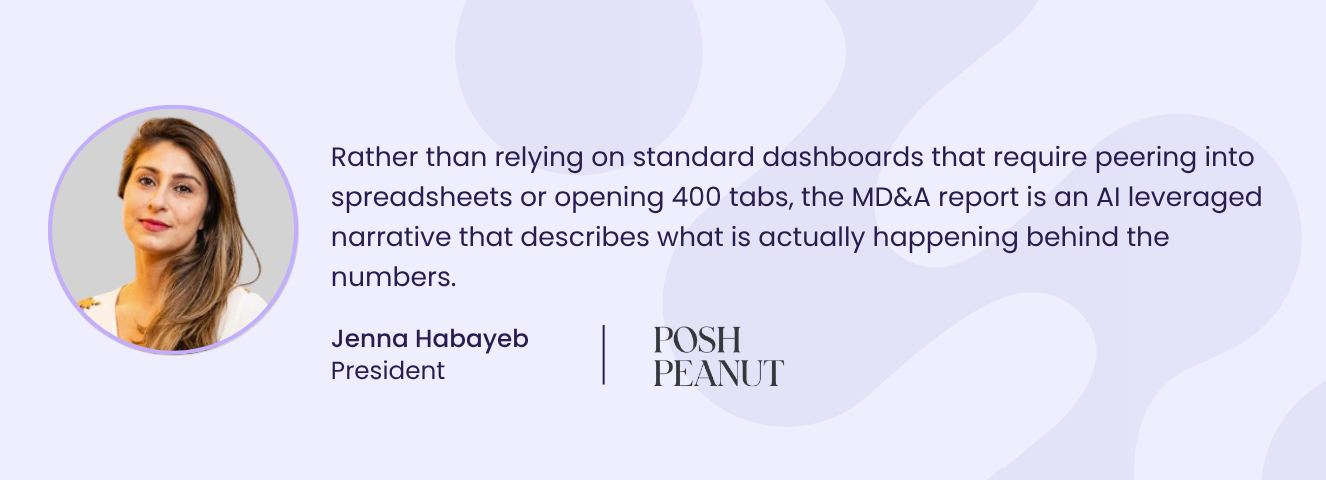
Why Saras iQ Delivers Channel-Level LTV Clarity for Shopify Brands
Generic AI tools can connect to a warehouse, but accurate answers depend on the quality, definitions, and context of the underlying data. Without consistent business logic, queries against raw warehouse data may produce conflicting LTV calculations. That uncertainty makes channel-level analysis less reliable for capital allocation decisions.
Saras iQ addresses this through three layers:
Certified Data Foundation
The data layer ingests 200+ ecommerce sources and models everything into 11 governed master datasets. 500+ daily QA checks validate data quality, and monthly reconciliation holds to a published plus or minus 1% tolerance for applicable metrics. This means channel-level LTV calculations start from governed data.
Context Layer
iQ's context layer holds business logic: how LTV is defined, which costs count toward CAC, how acquisition channels are classified, and which revenue exclusions apply. The same definitions apply whether the CEO asks in Slack or the CFO asks in a dashboard. No recalculation variance.
Validation Layer
iQ is tested against a golden set of client-specific questions, with logic refined to achieve 90%+ accuracy before going live. Regression testing runs on every change. The LLM does not access the warehouse directly; generated SQL runs through a controlled, read-only process designed to reduce inaccurate answers.
Proof in Practice
Ridge's team asked iQ 1,069 questions in 30 days across 18 users spanning CEO, marketing, product, ops, and finance, with zero analyst requests. Ridge's CEO, Sean Frank, has also described the significant business value of accessing Saras iQ through Claude.
For Shopify brands doing $10M or more that want to see their own channel-level customer analytics before committing, Saras offers a 30-day assisted trial. Request access through Saras, complete the qualification process, connect the applicable sales, advertising, and subscription platforms, and provide six required business inputs. Included trial analytics cover sales and marketing, contribution margin CM1, and customer analytics.
Your own data becomes available within five business days after all required connections and inputs are complete. There is no requirement to commit to the $10,000 implementation fee upfront to experience the trial.
Make Channel-Level LTV a Reliable Basis for Marketing Investment With Saras iQ in 2027
Customer lifetime value by acquisition channel helps Shopify brands identify where acquisition spending creates lasting value. But meaningful budget decisions require more than comparing channel benchmarks. Teams need consistent customer attribution, reliable acquisition costs, retention data, and contribution margin calculations.
For Shopify brands generating $10M or more annually, Saras iQ provides a governed foundation for analyzing these metrics across marketing and finance.
Before reallocating acquisition budgets, prioritize:
- Channel-level LTV: Compare customer value across acquisition sources and purchase cohorts.
- Fully loaded CAC: Include relevant marketing expenses beyond platform-reported advertising costs.
- Customer retention: Evaluate repeat purchases and lifetime value rather than first-order revenue alone.
- Contribution margin: Account for product costs, fulfillment, platform fees, and variable marketing expenses.
- Consistent definitions: Ensure finance and marketing evaluate performance using the same governed metrics.
Saras iQ combines certified ecommerce data, customer analytics, and validated business answers to support these decisions without relying on conflicting reports.
Request your 30-day assisted trial to evaluate customer analytics using your own connected Shopify business data before making a paid commitment.