Shopify merchants generated $14.6 billion in BFCM 2025 sales, up 27% from the previous year. But here's what separates the brands that thrived from those that just survived: the winners knew their numbers before Black Friday arrived. They could answer questions about profitability by channel, customer acquisition cost (CAC) by cohort, and contribution margin by SKU without waiting three days for their analyst to pull a report.
For Shopify DTC brands doing $10M or more in annual revenue, Saras iQ provides the AI Data Team and certified data foundation that turn these questions into trusted answers.
The data tells an even more compelling story about preparation. Stores that tracked their profitability saw net profit grow 64.5% during BFCM 2025 while revenue grew only 17.4%. These results highlight why brands should ask the right questions of their data before the shopping weekend begins, then make adjustments based on answers they can trust.
Question 1: What Is Your Target Net Profit Margin, Not Just Revenue?
Revenue goals dominate most BFCM planning conversations. But brands planning for peak season should also focus on profitability. Data-tracked Shopify stores achieved a 38.4% average net profit margin during BFCM 2025, representing a 40% improvement from the prior year.
Your data should answer:
- Current baseline margin: What's your net profit margin today, before BFCM discounting?
- Margin floor: What's the minimum acceptable margin during promotional periods?
- Cost structure breakdown: Where do your 28.8 cents per dollar of COGS actually go?
- Margin by channel: Which sales channels deliver the highest contribution margin (the revenue remaining after variable costs like COGS, shipping, and transaction fees)?
Contribution margin is the metric that matters here. It shows what's left after you subtract the relevant variable costs from revenue. Your marketing team might celebrate a record sales day while your finance team calculates that aggressive discounting and shipping promotions turned it into a net loss.
Brands using contribution margin analytics can track this metric daily, defined once and consistent across every team. When your CEO asks about profitability on Cyber Monday, the answer is the same whether finance, marketing, or operations pulls the number.
Question 2: What Percentage of Revenue Should Go to Advertising?
Tracked Shopify brands in 2025 spent 20.1% of revenue on advertising, down from 29.3% the prior year. That 9-point improvement highlights why brands should understand which channels deserve more spend and which deserve less.
Your data should reveal:
- Channel-level efficiency: What's your return on ad spend (ROAS) by platform after reconciling with actual revenue?
- Blended efficiency ratio: What's your marketing efficiency ratio (MER, total revenue divided by total marketing spend) across all paid channels?
- Marginal returns: At what spend level do additional dollars stop producing profitable orders?
- Platform discrepancies: Where does platform-reported ROAS diverge from your warehouse data?
The challenge is that paid search drove 30.8% of holiday revenue in 2025, while affiliates and partners drove 20.4%. But platform dashboards can overlap in their attribution. Your Google Ads account might claim credit for sales that your Meta pixel also claims.
This is where DTC brands can get stuck. They have data from every platform, but the numbers don't match. Sales and marketing analytics that standardize paid media grouping across Meta, Google, TikTok, Amazon Ads, and other platforms let you compare performance against consistent sales and marketing metrics.
Question 3: How Does Your BFCM CAC Compare to the Rest of the Year?
BFCM offers a counterintuitive advantage: customer acquisition costs dropped 9% during the 2024 shopping weekend compared to the previous month, even as brands increased ad spend by 25%. Higher intent, more traffic, and seasonal promotions can make peak season an efficient acquisition window.
Your data should clarify:
- CAC by channel: Which platforms deliver customers at the lowest acquisition cost during BFCM?
- CAC by cohort: Do BFCM-acquired customers have different lifetime value (LTV, the total revenue expected from a customer over their relationship with your brand) than customers acquired at other times?
- CAC threshold: At what acquisition cost do customers become unprofitable, accounting for their expected LTV?
- CAC vs. LTV ratio: What's the acceptable payback period for customers acquired during peak season?
The disconnect between marketing's CAC calculation and finance's CAC calculation creates real problems. Marketing might report $50 CAC based on platform data while finance calculates $80 after accounting for all acquisition costs. One number informs aggressive spending, the other suggests pulling back.
Customer analytics that define CAC once and enforce that definition across every team help eliminate this conflict. When your CMO and CFO present to the board, they present the same number.
Question 4: What's Your Mobile Conversion Rate?
Mobile devices accounted for 56.4% of all holiday sales in 2025, up from 54.5% the prior year. On Thanksgiving Day alone, mobile share reached 61.6%. If your mobile experience underperforms, you're leaving a substantial share of potential revenue on the table.
Your data should show:
- Device-specific conversion rates: How does mobile conversion compare to desktop?
- Cart abandonment by device: Where in the mobile checkout flow do customers drop off?
- Speed impact: How does page load time affect mobile conversion?
- Payment method adoption: What percentage of mobile customers use Shop Pay or other accelerated checkout?
Shopify reports that Shop Pay delivers up to 50% higher conversion than guest checkout and processes payments 4x faster. But knowing these benchmarks isn't enough. You need to know your own numbers, your own mobile conversion gap, and your own checkout abandonment rate.
The 70.22% average cart abandonment rate across ecommerce means most potential sales never complete. Of those abandonments, 39% cite unexpected extra costs as the reason. Your data foundation should connect checkout behavior to revenue impact, showing how much abandoned carts cost your business.
Question 5: How Much Traffic Comes from AI Assistants?
AI-driven traffic to retail sites grew 805% year-over-year on Black Friday 2025. AI-assisted shopping drove an estimated $3 billion in US online sales on that single day. This isn't a future trend. It's a current reality that analytics setups need to account for.
Your data should track:
- AI referral volume: What percentage of traffic comes from AI assistants like ChatGPT or Claude?
- AI visitor behavior: How do AI-referred visitors convert compared to other traffic sources?
- Attribution gaps: Are AI-driven sales being misattributed to direct traffic or other channels?
- Content optimization: Which product pages perform best with AI-assisted shoppers?
AI-referred visitors convert 31% better than other referral traffic, making this channel increasingly valuable. But traditional analytics can miss AI referrals, grouping them with direct traffic or unknown sources.
For BFCM 2026, brands need analytics that capture this growing channel and attribute sales correctly. Otherwise, you're making budget decisions with incomplete data.
Question 6: What's Your Average Order Value Trajectory?
Average order value (AOV) on Shopify during BFCM 2025 reached $114.70, with data-tracked stores seeing 5.4% AOV growth to $89.20. Understanding what drives AOV changes lets you optimize bundling, upselling, and threshold-based promotions.
Your data should reveal:
- AOV by acquisition channel: Do customers from different channels spend differently?
- AOV by customer type: How does first-order AOV compare to repeat customer AOV?
- Promotional impact: How do different discount structures affect AOV?
- Product mix influence: Which product combinations drive highest cart values?
The relationship between discounts and AOV creates tension. Deeper discounts might drive more orders but lower AOV and compress margins. Stores tracked by TrueProfit gave away approximately 28 cents in discounts for every dollar of net revenue during BFCM 2025. Knowing your own ratio, and how it affects profitability, should inform your promotional strategy.
Question 7: What's Your Discount-to-Revenue Ratio?
Discount depth averaged 20.2% of gross sales during BFCM 2025, down from 22.6% in 2024. Shallower discounts can help preserve margins, provided brands can maintain sufficient conversion rates.
Your data should clarify:
- Discount effectiveness: What's the minimum discount that meaningfully improves conversion?
- Category sensitivity: Which product categories require deeper discounts to move?
- Margin impact: How does each discount tier affect contribution margin?
- Competitive positioning: Are your discounts aligned with category benchmarks?
Electronics discounts peaked at 30.9% off, while apparel discounts reached 25.1% off. But these are averages. Your optimal discount strategy depends on your cost structure, competitive positioning, and customer expectations.
Understanding how returns distort contribution margin becomes critical here. A product that looks profitable at 20% off might become a loss leader after accounting for BFCM return rates.
Question 8: Which Channels Drive the Lowest CAC?
Meta took 82% of total ad spend during BFCM 2025 for tracked Shopify stores, with approximate ROAS of 2.2x. Google delivered approximately 2.3x ROAS. But platform-reported ROAS may not match warehouse-verified revenue, making channel comparison unreliable without a certified data foundation.
Your data should show:
- True channel CAC: What's each channel's CAC after reconciling platform data with actual revenue?
- Channel contribution: Which channels drive new customers versus reactivating existing ones?
- Incrementality signals: Which spend is driving truly incremental sales versus capturing demand that would have occurred anyway?
- Budget allocation: Where should the next marginal dollar go based on efficiency?
The challenge is that social media's share of holiday revenue grew 40% to reach 4.6% in 2025. Emerging channels like TikTok Shop demand evaluation alongside established platforms. Your analytics need to capture all channels in a standardized way that allows true comparison.
Question 9: What Percentage of BFCM Customers Become Repeat Buyers?
Acquiring a customer during BFCM is more valuable when that customer returns. Refunds averaged 1.7% of revenue during BFCM 2025, but the longer-term question is how many BFCM customers make a second purchase.
Your data should track:
- Cohort retention: What percentage of BFCM 2024 customers made a repeat purchase within 12 months?
- Channel quality: Which acquisition channels produce customers with highest LTV?
- Product path analysis: Which first-purchase products lead to highest repeat rates?
- Reactivation timing: When do BFCM customers typically make their second purchase?
Understanding cohort retention analysis lets you evaluate the true value of BFCM customer acquisition. A channel that delivers cheap first orders but poor retention might be less valuable than a channel with higher CAC but stronger lifetime value.
Over 81 million customers bought from Shopify-powered brands during BFCM 2025. The question is whether your share of those customers will generate long-term value or just a single discounted transaction.
Question 10: Can You Track Net Profit Daily During BFCM?
Brands that track profitability daily during BFCM can identify changes in ad efficiency, promotional performance, and contribution margin without waiting until month-end. This supports more informed adjustments to ad spend, promotions, and inventory allocation.
Your data capabilities should include:
- Daily P&L visibility: Can you calculate contribution margin by the morning after each selling day?
- Daily ad efficiency: Can you see which campaigns are profitable based on the latest available data?
- Inventory visibility: Can you identify when profitable SKUs are running low?
- Promotion performance: Can you measure the margin impact of each promotional lever using daily data?
The gap between daily contribution margin visibility and monthly financial close creates opportunity cost during BFCM. Brands that can answer these questions using daily refreshed data can make more informed budget decisions while the shopping weekend is still happening.
Building Your Data Foundation Before BFCM
Why Data Accuracy Matters More During Peak Season
Generic AI tools connected to raw warehouse data can produce inconsistent answers when business definitions and validation are missing. But during BFCM, you can't afford unreliable numbers. The difference between 2% and 5% EBITDA might affect decisions about whether your peak season was profitable.
The problem intensifies during high-stakes periods:
- Multiple people asking the same question: If your CEO, CFO, and CMO ask about contribution margin and get three different answers, trust erodes immediately
- Speed of decisions: You don't have three days to wait for your analyst to reconcile data when you need to adjust ad spend now
- Reconciliation complexity: Returns, shipping, fulfillment timing, and platform fees create accounting complexity that generic tools may handle inconsistently
A certified data foundation addresses these problems through three layers:
- Data certification: 500+ daily QA checks, weekly historical certification, and a published monthly reconciliation tolerance of plus or minus 1%
- Context layer: Your business logic, metric definitions, and exclusion rules encoded so the system knows what "revenue" means to your finance team versus your marketing team
- Validation layer: Testing against a golden set of questions specific to your business, refining answers to at least 90% accuracy before deployment
Creating a Single Source of Truth
The phrase "single source of truth" gets overused, but during BFCM it's not optional. When your finance team says net margin is 32% and your marketing team says 38%, inconsistent definitions can undermine confidence in both numbers.
A single source of truth requires:
- Unified metric definitions: Contribution margin calculated the same way, every time, regardless of who asks
- Governed data models: Standardized treatment of returns, refunds, discounts, shipping, and fees
- Consistent refresh timing: Everyone working from data that's current to the same timestamp
- Access controls: Appropriate visibility for each role without creating conflicting reports
Instant Hydration cut their month-end close from three days to two hours by implementing Saras iQ's semantic layer that enforced consistent definitions across teams. During BFCM, that kind of speed isn't a nice-to-have. It helps teams make informed decisions without waiting for manual reconciliation.
Why Saras iQ Helps DTC Brands Win BFCM
Saras iQ provides the AI Data Team that Shopify brands at $10M to $500M need to answer these questions confidently. Unlike generic AI tools or DIY connections between Claude and your data warehouse, iQ delivers deterministic answers: the same question returns the same answer regardless of who asks or when.
What makes this possible:
- Certified data foundation: 200+ sources modeled into 11 governed master datasets, with 500+ daily QA checks and monthly reconciliation tolerance of plus or minus 1%
- Context layer: Your business logic, metric definitions, and exclusion rules encoded so iQ understands what contribution margin means for your specific business
- Validation layer: Testing against 30 to 100 questions specific to your business, refining logic to 90%+ accuracy before you rely on answers
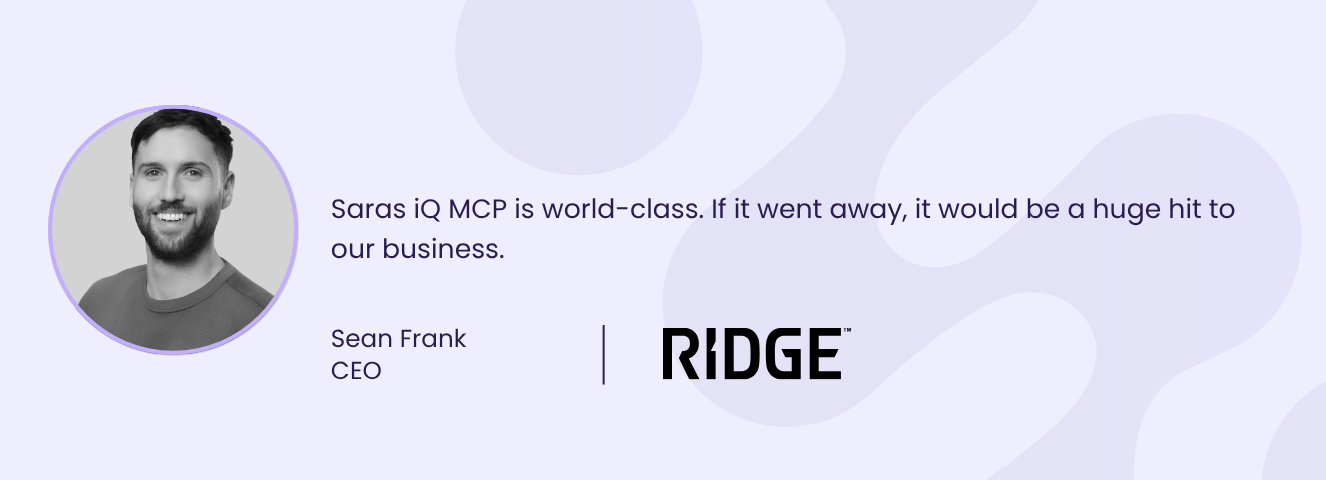
Ridge's team asked iQ 1,069 questions in 30 days across 18 users spanning CEO, marketing, product, ops, and finance, with zero analyst requests.
For BFCM planning specifically, iQ Essentials (from $1,999 per month for Shopify brands at $10M to $50M) delivers:
- Contribution margin analytics: Daily profitability by SKU, channel, and geography, defined once and consistent for every team
- Customer analytics: Cohort analysis, Recency plus Monetary segmentation, and acquisition attributes for Shopify and TikTok Shop customers
- Sales and marketing analytics: Standardized paid-media grouping across Meta, Google, TikTok, Amazon Ads, and other platforms with pacing versus targets
Qualified Shopify brands can see their own sales and marketing, CM1 contribution margin, and customer analytics through a 30-day human-assisted trial using their own data. After qualification, connecting applicable platforms, providing six required business inputs, and completing onboarding, data becomes available within five business days.
CM2/CM3, SKU-level costs, wholesale analytics, and sales targets remain outside the trial. Brands can evaluate their own numbers without committing to the $10,000 implementation fee upfront.
Prepare Your BFCM Data With Saras iQ
BFCM planning requires more than revenue forecasts. Shopify brands need consistent answers about contribution margin, customer acquisition, channel efficiency, and repeat purchases before committing promotional budgets.
For brands evaluating their analytics readiness, the most important checks are:
- Profitability: Define contribution margin consistently across products, channels, and teams, including discounts, fulfillment costs, and returns.
- Marketing efficiency: Reconcile paid-media reporting with actual sales and compare CAC, ROAS, and MER using consistent definitions.
- Customer value: Analyze acquisition cohorts and retention to distinguish profitable customers from one-time promotional buyers.
- Data reliability: Confirm refresh schedules, metric definitions, and validation processes before peak-season reporting begins.
Saras iQ brings these analyses together through its certified ecommerce data foundation, context layer, and AI Business Analyst. Essentials supports daily sales, marketing, customer, and contribution margin analytics, while Enterprise addresses more complex data requirements.
For qualified Shopify brands generating $10M or more annually, request an assisted trial to see your own BFCM planning numbers before committing.