Blended customer acquisition cost (CAC) and channel CAC measure acquisition efficiency differently, which can lead to different budget decisions. Blended CAC shows the average cost of acquiring a customer across all channels, while channel CAC reveals the cost associated with each acquisition source. With ecommerce acquisition costs rising, Shopify brands doing $10M or more need to track both metrics.
A unified sales and marketing analytics foundation ensures your finance and marketing teams work from the same definitions, so every dollar you allocate is backed by data you can defend.
Is your data actually Decision-Grade?
9 questions. 3 minutes. Score your Profitability Visibility and Readiness for AI-driven growth.
Start Free Diagnostic
Understanding Customer Acquisition Cost: Blended vs Channel-Specific
Customer acquisition cost measures the total expense required to convert a prospect into a paying customer. The formula is straightforward: divide total marketing and sales spend by the number of new customers acquired. However, how you define "total spend" determines whether you're looking at a blended or channel-specific view.
Blended CAC aggregates all acquisition spending across every channel, then divides by total new customers. This number tells you what it costs, on average, to acquire any customer regardless of source.
Channel CAC isolates spending and conversions by individual marketing channel. This reveals which channels deliver customers efficiently and which drain your budget.
The distinction matters because:
- Budget allocation decisions require channel-level visibility to shift dollars toward efficient sources
- Board reporting often uses blended CAC for executive summaries, hiding performance gaps
- Marketing optimization depends on knowing where marginal dollars produce the best returns
- Profitability analysis connects acquisition costs to customer lifetime value (LTV) by cohort and source
Without both metrics, you're making budget decisions on incomplete data.
The Blended CAC Formula: A High-Level View of Your Acquisition Efficiency
Blended CAC provides the 30,000-foot view your board and investors expect. The calculation is simple:
Blended CAC = Total Marketing and Sales Spend ÷ Total New Customers
For a Shopify brand spending $500,000 monthly across Meta, Google, email, and influencer campaigns while acquiring 10,000 new customers, blended CAC equals $50.
This metric serves specific purposes:
- Investor reporting: VCs and PE sponsors want a single number to benchmark against portfolio companies
- Year-over-year trending: Track whether overall acquisition efficiency improves or declines
- High-level budget planning: Set initial acquisition budgets based on revenue targets
The problem is that blended CAC obscures the underlying reality. Acquisition costs can vary significantly between paid search and referrals. A blended number smooths over these differences, making every channel appear equally efficient when they're not.
If your blended CAC looks healthy but your paid channels are underwater, you're subsidizing inefficiency with organic performance.
Breaking Down Channel CAC: Identifying Profitable Growth Opportunities
Channel CAC reveals the true cost structure hiding beneath blended numbers. Each acquisition source carries distinct economics:
Organic Channels
- SEO/Organic Search: Acquisition costs depend on content production, optimization, and the number of new customers acquired, with potential compounding returns over time
- Referral/Word of Mouth: Costs depend on referral incentives, program management, and the volume of customers acquired
- Email Marketing: Acquisition costs depend on platform fees, campaign production, and the number of new customers converted
Paid Channels
- Meta Ads: CAC varies by industry, audience, campaign objective, and advertising competition
- Google Search Ads: CAC depends on keyword competition, conversion rates, and customer acquisition volume
- LinkedIn Ads: Often used for high-value B2B customer acquisition, where deal economics can support higher acquisition costs
Industry-Specific DTC Benchmarks
Vertical matters significantly. Acquisition costs vary across categories because of differences in purchase frequency, average order value, margins, and advertising competition.
- Pet products: CAC depends on repeat purchase behavior and customer retention
- Fashion: CAC is influenced by competition, seasonality, and customer loyalty
- Beauty: CAC varies with repeat purchase rates and advertising performance
- Home goods: Longer purchase cycles can affect acquisition economics
- Food and beverage: Subscription models and repeat purchases influence CAC sustainability
- Fitness: Acquisition costs vary across apparel, equipment, and other product categories
- Supplements: Customer retention and subscription behavior play an important role in acquisition economics
Tracking channel CAC requires standardized paid-media grouping that maps platform data consistently. Without a contribution margin analytics foundation, channel CAC calculations vary depending on who runs the report.
Why Attribution Models Determine Your Channel CAC Accuracy
The attribution model you choose dramatically impacts channel CAC calculations. First-touch attribution credits the initial touchpoint with the entire conversion value. Last-touch gives all credit to the final interaction before purchase. Neither reflects reality for customers who engage across multiple channels.
Consider a customer who:
- Discovers your brand through an Instagram ad
- Reads a blog post via organic search
- Receives an email with a discount code
- Converts through a Google Shopping click
First-touch credits Instagram. Last-touch credits Google Shopping. Linear attribution splits credit equally. Time-decay weights recent interactions more heavily. Each model produces a different channel CAC.
iOS 14.5+ privacy changes reduced paid ad targeting precision by 23%, making platform-reported attribution even less reliable. App Tracking Transparency also limits cross-app tracking when users decline permission, creating gaps in platform attribution data.
For Shopify brands in the $10M to $50M range, multi-touch attribution modeling often requires more data infrastructure than the business can support. The practical solution is validating platform-reported numbers against warehouse revenue data. When Meta claims a ROAS of 4.0 but your bank account shows different results, certified data provides a consistent basis for reconciliation.
Connecting CAC to Customer Lifetime Value for Sustainable Growth
CAC means nothing without context. A $100 CAC is excellent if those customers generate $500 in lifetime value. It's a disaster if they churn after one $75 purchase.
The LTV ratio helps assess acquisition sustainability:
- Below 1:1: Customer lifetime revenue is lower than acquisition cost
- 1:1 to 3:1: Profitability depends heavily on contribution margin and operating costs
- 3:1 to 4:1: A commonly used benchmark that still requires validation against actual margins
- Above 5:1: Potentially underinvesting in growth
A good CAC payback period for DTC depends on product margins, repeat purchase frequency, and available working capital. Shorter payback periods recover acquisition costs sooner, freeing capital for additional growth investment.
Calculating accurate LTV requires customer analytics that track:
- Purchase frequency by acquisition source
- Average order value trends over customer lifetime
- Retention curves showing when customers churn
- Cohort behavior comparing acquisition periods
The probability of selling to an existing customer is often cited as 60% to 70%, compared with 5% to 20% for a new prospect. Retention improvements can also increase profitability by extending customer lifetime value. These economics explain why DTC brands need to balance acquisition with retention investment.
Beyond CAC: Integrating Contribution Margin for True Profitability
ROAS tells you revenue generated per ad dollar spent. Channel CAC tells you acquisition cost. Neither tells you whether a channel is actually profitable after accounting for:
- SKU-level COGS: Product costs vary by item
- Fulfillment expenses: Shipping, packaging, handling
- Platform fees: Payment processing, marketplace charges
- Fixed cost allocations: Overhead attributed to each order
- Marketing costs: The CAC itself
Contribution margin (the revenue remaining after variable costs) provides the complete picture. A channel with $50 CAC might look worse than one with $30 CAC until you realize the first channel acquires customers who purchase high-margin products while the second drives traffic to money-losing SKUs.
CAC calculations can understate acquisition spending when they exclude agency fees, creative production, affiliate commissions, or marketing tools. Once these costs are included, the reported acquisition cost may be materially higher than the media-only CAC shown in marketing dashboards.
Daily contribution margin visibility lets you catch profitability problems before they compound. When your CFO and CMO disagree on what CAC "should" be, the root cause is usually different definitions, different cost inclusions, and different data sources.
Why Your Current CAC Calculation Might Be Misleading You
Three structural problems can undermine CAC calculations:
Data Fragmentation
Your ad platforms report one set of numbers. Your Shopify dashboard shows another. Your finance team reconciles a third from bank statements. Manual exports and spreadsheet reconciliation introduce errors that compound monthly.
Inconsistent Definitions
Marketing counts only media spend. Finance includes agency fees, creative production, and tool subscriptions. Operations adds fulfillment costs for acquisition-focused promotions. Without a single source of truth, every team defends their version.
Platform Discrepancies
Meta Ads ROI dropped 9% year-over-year while Google Ads ROI fell 8%. Platform dashboards may not reflect the same performance because they use their own attribution models. When your Meta ROAS stays flat but actual revenue drops, the platform isn't necessarily reporting incorrectly; it's measuring differently than your financial records.
The fix requires governed metric definitions that every team queries the same way. When contribution margin is defined once, with the same COGS, fulfillment, and fee allocations regardless of who asks, you eliminate the "three different numbers" problem.
Driving Your Ecommerce Budget in 2026: A Strategic Approach
The data points toward a clear 2026 strategy: shift budget toward high-ROI channels while maintaining paid presence for scale.
Channel ROI Comparison
- Email Marketing: CAC varies by brand, with a 289% three-year ROI and a break-even period of 6 months.
- SEO/Organic: CAC varies by brand, with a 748% three-year ROI and a break-even period of 8–10 months.
- Referral: CAC varies by brand, with no standardized three-year ROI or break-even period.
- Meta Ads: CAC varies by brand, with a 79% three-year ROI and a break-even period of 3 months.
- Google Ads: CAC varies by brand, with a 33% three-year ROI and a break-even period of 4 months.
Budget Allocation by Company Size
Small businesses allocate 28% of budgets to SEO, while enterprise companies allocate 33% to paid search. This suggests sophistication drives different channel ROI calculations, not that paid channels are inherently better for larger brands.
For Shopify brands in the $10M to $50M range, the optimal approach combines:
- Blended CAC for board reporting and high-level benchmarking
- Channel CAC for tactical budget allocation and optimization
- Contribution margin by channel for true profitability assessment
- LTV by acquisition source for sustainable growth planning
This requires data infrastructure beyond spreadsheets and manual reconciliation.
Why Saras iQ Delivers Trusted CAC and Contribution Margin Analytics
Tracking both blended and channel CAC requires more than dashboards. It requires a certified data foundation that ensures finance, marketing, and leadership see the same numbers.
Saras iQ is an AI Data Team built for Shopify DTC brands at $10M to $500M. Rather than connecting an LLM directly to raw warehouse data, where the same question can produce different answers depending on who asks, iQ's context layer holds your business logic, metric definitions, and cost allocations. The same CAC calculation runs identically every time.
What this means for your CAC analysis:
- Standardized paid-media grouping maps Meta, Google, TikTok, and other platforms to consistent channel definitions
- Contribution margin by channel includes COGS, fulfillment, platform fees, and marketing costs, calculated daily
- Customer analytics track LTV by acquisition source with Recency and Monetary segmentation
- Targets vs actuals show pacing against goals, not just historical performance
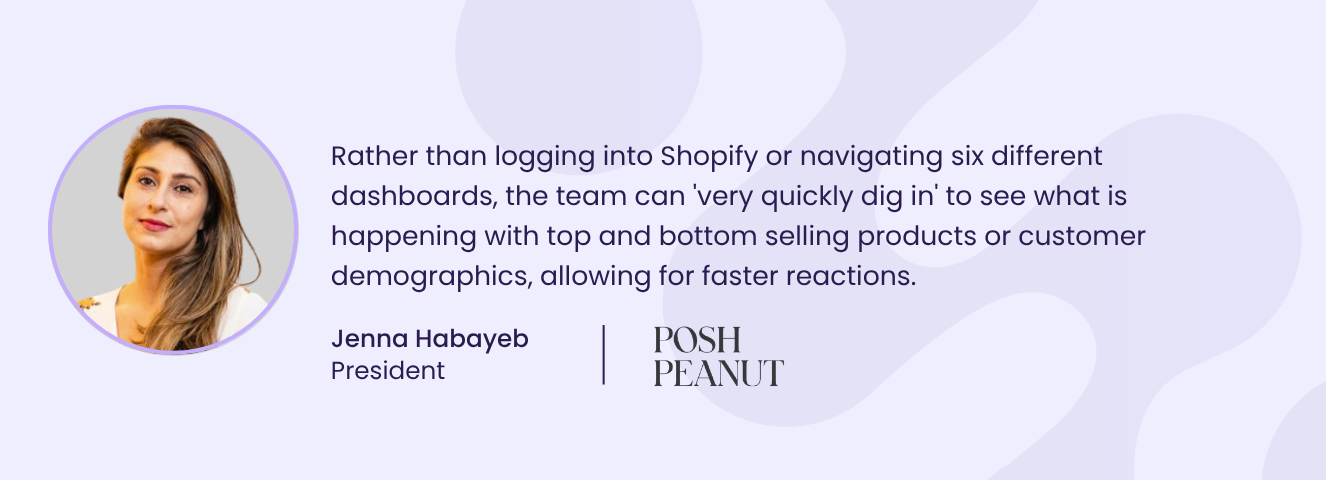
Ridge's team asked iQ 1,069 questions in 30 days across 18 users spanning the CEO, marketing, product, ops, and finance, with zero analyst requests. CEO Sean Frank noted that Saras iQ inside Claude is worth over $50,000 a month to their business.
Qualified Shopify brands can evaluate their own sales and marketing analytics, CM1 contribution margin, and customer analytics through a 30-day, human-assisted Saras iQ trial. After qualification, required platform connections, and business inputs are completed, data becomes available within five business days.
The trial does not require an upfront $10,000 implementation-fee commitment. SKU-level costs, CM2/CM3, wholesale analytics, and sales targets are available after paid conversion.
Choose the Right CAC Metrics Before Allocating Your Ecommerce Budget in 2027
Blended CAC and channel CAC serve different purposes, but neither provides enough context to make profitable budget decisions alone. For Shopify brands doing $10M or more in annual revenue, acquisition efficiency must also account for customer lifetime value, contribution margin, and consistent cost definitions.
Before adjusting marketing spend, evaluate four areas:
- Blended CAC: Monitor overall acquisition efficiency and communicate performance to leadership.
- Channel CAC: Identify acquisition sources that warrant increased investment or closer scrutiny.
- LTV by acquisition source: Understand which channels attract customers who generate repeat revenue.
- Contribution margin: Determine whether customer acquisition remains profitable after product, fulfillment, platform, and marketing costs.
Saras iQ brings these metrics into a certified data foundation with governed definitions, helping finance and marketing evaluate channel performance using consistent numbers. Its customer analytics, paid-media grouping, and daily contribution margin reporting support decisions beyond platform-reported ROAS.
For qualified Shopify brands, request your 30-day trial to evaluate your own acquisition and profitability data before committing to implementation.