
Self-service BI tools are designed to help business users explore data without relying on IT for every report. However, answering complex ecommerce questions can still require calculated fields, data modeling, or technical support.
Only 20% of non-IT professionals can reportedly fulfill their own BI needs without technical help. The gap between the promise and reality comes down to one thing: many "self-service" tools still require DAX formulas, LookML, or calculated fields that might as well be SQL.
For Shopify brands generating $10M or more in annual revenue, this gap can make profitability analysis harder. You need accurate contribution margin (revenue minus variable costs like COGS, shipping, and marketing), reliable customer acquisition cost (CAC), and clear lifetime value (LTV) calculations. A certified data foundation is the starting point, but without a self-service layer that business users can actually use, you are back to waiting on analysts.
This guide ranks 10 self-service BI tools by one criterion: how little SQL (or SQL-equivalent technical knowledge) you actually need. Each tool receives an editorial SQL Avoidance Score based on documented capabilities, user feedback, and the technical complexity of common ecommerce workflows.
Self-Service BI Tools at a Glance
Ratings shown are from October 2026 and are subject to change.
What Shopify Brands Should Look for in a Self-Service BI Tool
Most BI tools were built for general business intelligence, not for ecommerce-specific challenges. A Shopify brand selling across multiple channels needs a tool that understands platform-specific data: Shopify's discount and refund logic, Amazon's transaction types, Meta's post-iOS reporting gaps, and the difference between gross margin and contribution margin.
When evaluating self-service BI tools for Shopify, prioritize:
- True self-service for business users. If your CMO cannot answer "what was our CAC by channel last month?" without help from IT, it is not self-service.
- Ecommerce-specific metric definitions. Contribution margin is not just "revenue minus COGS." It includes fulfillment costs, platform fees, and marketing spend allocated correctly.
- Governed, consistent answers. When your CFO and CMO ask the same question using the same data and reporting period, they should get the same number. This requires a semantic layer with defined metrics.
- Integration with your existing data. Shopify, ad platforms, subscription tools like Recharge, and fulfillment data should connect without custom engineering.
- Validation and accuracy. AI that hallucinates numbers is worse than no AI at all. Look for tools with documented accuracy testing.
The real question is whether you need a tool that simply visualizes data or one that provides governed answers you can trust for board meetings and investor conversations.
1) Saras iQ
SQL Avoidance Score: 10/10
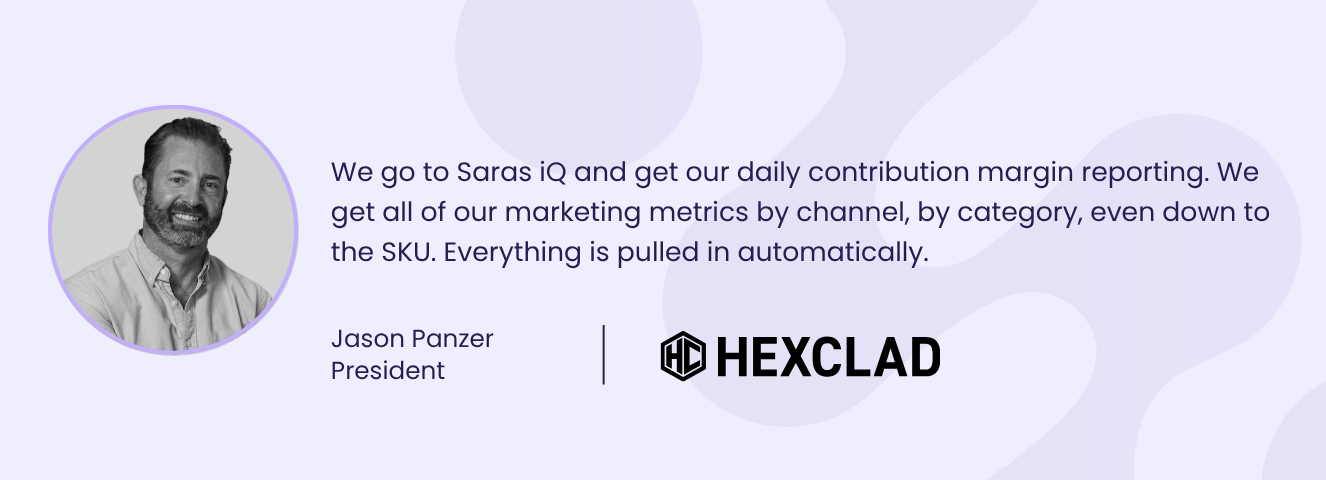
Saras iQ is an AI Data Team built specifically for Shopify brands. Unlike general BI tools that require you to build dashboards and write formulas, iQ answers supported plain-English business questions using governed metrics and certified data. Ask "what was our contribution margin by channel last month?" and get a consistent answer based on defined business logic and the available reporting data.
Why It Ranks First
Saras iQ receives a 10/10 editorial SQL Avoidance Score because its conversational interface allows business users to answer supported analytical questions without writing SQL. The iQ Business Analyst handles natural language queries, summaries, and dashboards. The iQ Data Engineer answers operational questions in Slack ("Has today's data loaded?" "How is this metric calculated?"). The iQ MCP (Model Context Protocol) connects the certified data foundation to Claude, so you get governed answers inside your AI assistant.
The difference between iQ and connecting an LLM directly to your warehouse is accuracy. Generic AI tools can produce inconsistent answers when they lack the necessary business context. As demonstrated in the Claude and BigQuery comparison, iQ's context layer encodes your business logic, metric definitions, and exclusion rules. A validation layer tests answers against 30 to 100 client-specific questions and refines the logic toward a 90%+ accuracy target.
Ridge's team asked iQ 1,069 questions in 30 days across 18 users spanning the CEO, marketing, product, ops, and finance, with zero analyst requests. Ridge CEO Sean Frank has valued the ability to use Saras iQ inside Claude at more than $50,000 per month for the business.
Key Features
- iQ Business Analyst: Plain-English Q&A with deterministic answers across contribution margin, customer analytics, and sales and marketing
- Certified data foundation: 200+ sources modeled into 11 governed master datasets with 500+ daily QA checks
- Context layer: Your metric definitions, business logic, and exclusion rules encoded so the AI knows your business
- Validation layer: Golden test set of 30-100 client questions, regression testing on every change
- Monthly reconciliation tolerance: Plus or minus 1%
What to Review
iQ Essentials starts from $1,999 per month for Shopify brands at $10M to $50M and goes live in about three weeks. It includes three certified use cases (contribution margin, customer analytics, sales and marketing), iQ Chat, iQ Data Engineer, iQ MCP for Claude, and Slack integration. iQ Enterprise serves brands at $50M to $500M with custom semantic layers, multi-entity support, and advanced integrations.
Qualified Shopify DTC brands can request a 30-day human-assisted trial using their own business data. The trial covers Sales & Marketing Analytics, CM1 contribution margin, and Customer Analytics, rather than the full paid Essentials feature set. After qualification, required platform connections, six business inputs, and assisted onboarding are completed, data becomes available within five business days.
2) Luca AI
SQL Avoidance Score: 10/10
Luca AI positions itself as an AI layer over unified ecommerce data that returns root-cause reasoning instead of charts. Ask "which SKU has the highest return rate?" and get an explanation, not a dashboard to interpret.
Why It Scores High
Luca AI achieves a perfect SQL Avoidance Score because there are no dashboards to build and no formulas to write. The platform handles natural language queries and provides reasoning about why metrics changed, not just what the numbers are.
The company claims 200+ connectors including Shopify, Meta, Google, and Klaviyo.
Key Features
- Plain English questions with no SQL or dashboards required
- Root-cause analysis that explains "why" metrics changed
- Proactive alerts pushed to Slack or email
- Contribution margin tracking beyond gross margin
- 200+ connectors for ecommerce data sources
What to Review
The platform targets smaller brands than Saras iQ (€1M to €5M vs $10M to $500M), so brands requiring investor-grade reporting should evaluate its governance and validation capabilities. Verify that its metric definitions match your finance team's requirements before committing.
3) Triple Whale
SQL Avoidance Score: 9/10
Triple Whale is the most widely adopted ecommerce analytics platform, serving 30,000+ Shopify brands. The platform's strength is its first-party attribution pixel (Triple Pixel) and Moby AI assistant that handles natural language queries about marketing performance.
Why It Scores High
Triple Whale earns a 9/10 because Moby AI handles most marketing questions without technical knowledge. The platform also offers cohort analysis, creative analytics, and marketing mix modeling on higher tiers.
The Triple Pixel collects first-party data independent of platform tracking, achieving 70-85% match rates compared to 40-60% for raw platform pixels. This matters as cookie deprecation continues.
Key Features
- Triple Pixel first-party attribution surviving cookie deprecation
- Moby AI assistant for natural language marketing queries
- Creative-level analytics tracking ad performance by variant
- Cohort analysis and customer lifetime value tracking
- Marketing Mix Modeling on upper plans
What to Review
Triple Whale's strength is marketing attribution, not finance-grade profitability. The platform does not connect accounting or banking data, so contribution margin calculations may not match what your CFO needs for board reporting. SQL access is available on higher tiers but optional for most users.
4) ThoughtSpot
SQL Avoidance Score: 8/10
ThoughtSpot pioneered the search-driven analytics approach, letting users type questions in natural language instead of building dashboards. The Spotter AI agent handles follow-up questions, and SpotIQ automatically detects anomalies in your data.
Why It Scores Well
ThoughtSpot earns an 8/10 because its search-first interface is genuinely accessible to non-technical users.
The platform works best when connected to an existing data warehouse (Snowflake, BigQuery, Databricks, or Redshift) with clean, modeled data. Without that foundation, the search experience degrades.
Key Features
- Natural language search interface for instant answers
- Spotter AI agent for conversational follow-ups
- SpotIQ automated insight detection
- Embeddable analytics for customer-facing use
- Semantic modeling layer for governed metrics
What to Review
ThoughtSpot requires a data warehouse and modeling layer, which adds complexity and cost for brands without existing infrastructure. Custom formulas use a proprietary syntax that does not follow SQL or Excel conventions, creating a learning curve for advanced use cases.
5) Polar Analytics
SQL Avoidance Score: 8/10
Polar Analytics positions itself as a "no-code Shopify data team" that includes both the data warehouse (Snowflake) and the analytics layer. The platform offers 400+ prebuilt ecommerce metrics and an Ask Polar AI assistant for natural language queries.
Why It Scores Well
Polar earns an 8/10 because its no-code interface handles most ecommerce reporting without technical skills. The platform includes five attribution models, cohort analysis, and a dedicated Snowflake database so you own your data.
Key Features
- 400+ prebuilt ecommerce metrics standardized
- Dedicated Snowflake database included (you own the data)
- Ask Polar AI for natural language queries
- Five multi-touch attribution models
- No-code custom metric builder
What to Review
Polar's strength is accessibility, not finance-grade governance. The platform may lack the validation and semantic layer rigor that larger brands need for board-level reporting. SQL access is available for power users but most features work without it.
6) Looker Studio
SQL Avoidance Score: 7/10
Looker Studio (formerly Google Data Studio) is Google's free cloud-based visualization tool. It connects natively to Google Ads, GA4, BigQuery, and Google Sheets, making it the fastest starting point for brands in the Google ecosystem.
Why It Scores Moderately
Looker Studio earns a 7/10 because drag-and-drop chart building works for simple reports. However, calculated fields get technical quickly, and data blending (combining multiple sources) causes significant performance issues.
Key Features
- Completely free for unlimited dashboards and sharing
- Native Google Ads, GA4, BigQuery, and Sheets connectors
- Drag-and-drop chart builder
- Community connectors for Shopify and Facebook
- Pro tier at $9 per user per month for team features
What to Review
Free comes with trade-offs. Looker Studio is visualization-only: it does not include data storage, transformation, or governance. Community connectors for Shopify and ad platforms vary in quality and reliability. For brands with large datasets or complex multi-source reporting, performance issues become a daily frustration.
7) Zoho Analytics
SQL Avoidance Score: 7/10
Zoho Analytics is the value play in self-service BI, starting at $8 per user per month with 500+ connectors and an AI assistant called Zia. The platform targets small to mid-market businesses that want accessible analytics without enterprise pricing.
Why It Scores Moderately
Zoho earns a 7/10 because Zia AI helps non-technical users with common queries, and the drag-and-drop interface works for standard reports. However, complex reporting still requires SQL knowledge, and ecommerce-specific metric definitions are limited.
Key Features
- 500+ native data connectors with no extra fees
- Zia AI assistant for natural language queries
- Transparent pricing starting at $8 per user per month
- Account-based pricing option for smaller plans
- SOC 2 and GDPR compliance
What to Review
The platform lacks the ecommerce-specific semantic layer that Shopify brands need for accurate contribution margin and CAC calculations. Integration with Shopify exists, but you will need to build your own metric definitions and validation processes.
8) Metabase
SQL Avoidance Score: 7/10
Metabase is the leading open-source BI tool, used by 100,000+ organizations. The platform offers a no-code question builder for simple queries while maintaining SQL access for power users.
Why It Scores Moderately
Metabase earns a 7/10 because its question builder genuinely works for non-technical users on simple queries. However, the platform requires a data warehouse, and complex questions still need SQL knowledge.
Key Features
- No-code question builder for simple queries
- Native SQL editor for power users
- Self-hosted (free) or cloud options
- Dashboard subscriptions via email and Slack
- Open-source with active community
What to Review
Metabase does not include data modeling or ecommerce-specific connectors, so you need to build that infrastructure separately.
9) Tableau
SQL Avoidance Score: 6/10
Tableau is the gold standard for data visualization, consistently earning top ratings for chart quality and exploration depth. The Salesforce acquisition in 2019 added CRM integration, but the core product remains analyst-focused.
Why It Scores Lower
Tableau earns a 6/10 because while drag-and-drop exists, real ecommerce analysis requires calculated fields, table calculations, and Tableau Prep for data transformation.
Implementation typically takes 4-6 weeks for enterprises, significantly longer than cloud-native alternatives.
Key Features
- Industry-leading data visualizations
- Drag-and-drop interface for dashboard building
- Tableau Prep for visual data transformation
- Large community with thousands of templates
- Native Salesforce CRM integration
What to Review
For Shopify brands, Tableau requires a separate data warehouse and significant analyst time to build and maintain ecommerce-specific reports. The "no-code" promise breaks down quickly for contribution margin, CAC, and LTV calculations.
10) Power BI
SQL Avoidance Score: 5/10
Power BI is Microsoft's answer to Tableau, offering lower pricing and native integration with Excel, Teams, and Azure. The platform saves an average of 125 hours per year per BI user through self-service features.
Why It Scores Lowest
Power BI earns a 5/10 because DAX (Data Analysis Expressions) is required for any meaningful ecommerce analysis. DAX is a formula language that, while not SQL, has a comparable learning curve.
80% of organizations have siloed data, and Power BI does not solve that problem automatically. You still need to build the data model, define relationships, and create measures.
Key Features
- Native Microsoft ecosystem integration
- Semantic models for reusable data definitions
- Strong governance and security features
- Large community and training resources
What to Review
Power BI's "self-service" marketing does not match reality for non-technical users. Building contribution margin reports requires DAX proficiency. The platform also requires a separate data warehouse or data source configuration, adding complexity for brands without existing infrastructure.
Why SQL Avoidance Matters for Ecommerce Profitability
The gap between self-service marketing and self-service reality can affect Shopify brands in three ways:
- Time to insight. When your CMO asks "what was our CAC by channel?" and needs an analyst to build the report, decisions may be delayed. Brands with self-service analytics can answer supported questions without requesting a new report each time.
- Metric consistency. Your CFO, CMO, and COO should get the same answer when they ask about contribution margin using the same data and reporting period. Without a governed semantic layer, each team builds their own calculations with different assumptions. The result can be conflicting numbers in your board deck.
- Analyst capacity. When analysts spend substantial time answering repetitive questions, they have less capacity for strategic analysis. Self-service tools can reduce the need for routine reporting requests, allowing analysts to focus on more complex work.
For Shopify brands generating $10M or more, the question is not simply whether to invest in analytics, but whether to invest in tools your team can actually use.
Choose Saras iQ for Governed, SQL-Free Ecommerce Analytics
The right self-service BI tool should help business users answer meaningful questions without requiring an analyst to write queries for every request. For Shopify brands generating $10M or more annually, SQL avoidance is only one consideration. Consistent metric definitions, reliable data integration, and validation also matter when evaluating profitability and customer performance.
Saras iQ combines conversational analytics with a certified ecommerce data foundation, allowing teams to explore supported business questions using governed metrics.
When comparing tools, prioritize:
- SQL accessibility: Can business users ask questions without writing formulas or queries?
- Metric consistency: Are contribution margin, CAC, and LTV calculated using defined business logic?
- Data reliability: Are datasets certified and analytical responses validated?
- Implementation: Does the solution support the brand's existing commerce, advertising, and subscription systems?
Qualified Shopify DTC brands can request a 30-day assisted trial to evaluate their own sales, CM1 contribution margin, and customer analytics before committing to the $10,000 implementation fee upfront.