BeProfit helps ecommerce merchants understand profitability by bringing sales, advertising expenses, shipping costs, and product costs into one reporting platform. For Shopify brands evaluating the app, the important questions are how accurately it captures costs, which reporting features are included in each plan, and whether its analytics meet the business's needs.
BeProfit's acquisition by Viably in October 2024 and customer feedback about advertising spend attribution and billing add considerations for merchants evaluating the platform. For Shopify brands generating $10M+ annually, the evaluation may also involve whether a certified data foundation offers the governance and consistency needed for financial reporting.
What BeProfit Does and Who It Serves
BeProfit is a profit analytics app that consolidates costs across multiple ecommerce platforms to calculate net profit at the order, product, and store level. The app launched in September 2020 and was acquired by Viably in October 2024, rebranding as "Viably Profit Analytics (formerly BeProfit)."
The core value proposition is straightforward: connect your sales channels, input your costs, and see profit instead of just revenue. BeProfit tracks:
- Cost of Goods Sold (COGS): Manual input per product or bulk upload
- Shipping costs: Carrier fees, packaging, and fulfillment
- Transaction fees: Payment processor charges, marketplace fees
- Marketing spend: Ad platform connections for Meta, Google, TikTok, Pinterest, and Snapchat
- Discounts and returns: Factored into net profit calculations
The app supports multichannel profit reporting, including Shopify and Amazon.
Who BeProfit Works Best For
Best for:
- Multi-platform sellers running stores on Shopify plus Amazon, WooCommerce, or Wix who need consolidated profit reporting
- Brands whose advertising spend reconciles accurately with their connected ad platforms
- Small to mid-sized merchants with straightforward cost structures who can maintain manual COGS updates
Not ideal for:
- Brands with significant Google Ads spend who cannot reconcile imported advertising costs
- Growing companies that need board-ready financials with audit trails
- Teams that need consistent metric definitions across finance, marketing, and operations
Core Features: What BeProfit Actually Delivers
Profit and Loss Dashboard
BeProfit's central feature is a real-time P&L dashboard that breaks down revenue, costs, and profit at multiple levels. Users can view profitability by:
- Individual orders
- Products and product variants
- Time periods (daily, weekly, monthly)
- Sales channels and stores
The dashboard updates as orders come in, giving merchants visibility into daily profitability rather than waiting for monthly accounting closes.
Multi-Channel Cost Tracking
The app connects to ad platforms and pulls spend data automatically for:
- Meta (Facebook and Instagram)
- TikTok
- Snapchat
- Google Ads (with significant limitations, covered below)
For non-advertising costs, BeProfit supports manual entry and bulk CSV uploads. Shipping costs can be configured as flat rates, percentage-based, or connected to fulfillment apps.
Reporting and Export Capabilities
BeProfit includes custom report builders and data export options. The Ultimate Plan ($149/month) adds cohort analysis, while the Plus (Enterprise) plan ($249/month) includes API access for brands that need to pull data into external systems.
However, users should note that product costs must be mapped manually. Unlike platforms that pull COGS from inventory systems, BeProfit requires merchants to enter and maintain cost data themselves.
The Google Ads Problem: A Critical Limitation
One Shopify App Store reviewer reported that BeProfit imported approximately 15% of their Google Ads spend despite being connected to the advertising account. This is an individual customer report, not a verified platform-wide capture rate.
How This Affects Profit Calculations
If advertising costs are missing from profitability reporting, the resulting margin figures can be overstated. Merchants should reconcile imported Google Ads spend with their advertising account before relying on those figures.
A Shopify App Store review describes this experience:
"Despite being fully connected to our Google Ads account, it only imported ~15% of our actual Google Ads spend."
The review alone does not establish whether this behavior affects other accounts or campaigns.
The Business Impact
Merchants should compare reported ad costs against actual platform spend. Any material discrepancy could distort product and campaign profitability.
For brands making inventory, pricing, or marketing decisions based on profit data, this inaccuracy can lead to:
- Over-investment in underperforming campaigns
- Incorrect product margin assumptions
- Misleading financial reports
Post-Acquisition Changes: Support and Product Direction
Some Shopify App Store reviewers have reported concerns about customer support and billing following BeProfit's acquisition.
Some reviewers have described difficulties reaching customer support.
Another user reported billing issues:
"Someone installed this app in 2023 and the company has been paying $720 per year since --- never used. They will not respond to my emails and will not cancel the subscription or refund even though I requested cancellation prior to being charged."
Customer Review Feedback
While BeProfit maintains a 4.5/5 rating on Shopify with 203 reviews, individual reviews describe concerns about billing and support. These complaints do not establish a decline in the overall rating or a change to the product roadmap.
BeProfit Pricing: What You Pay and What You Get
BeProfit uses order-based pricing tiers:
- Basic Plan ($49/month): Supports up to 450 orders, with a profit and expense dashboard and unlimited ad integrations.
- Pro ($99/month): Supports up to 900 orders and includes custom reports and a P&L report.
- Ultimate Plan ($149/month): Supports up to 1,700 orders and adds LTV cohort analysis and UTM attribution.
- Plus (Enterprise) ($249/month): Includes unlimited orders, unlimited shops and platforms, and API access.
For multi-store operations, the Plus (Enterprise) plan at $249/month for unlimited stores represents competitive value compared to per-store pricing models.
Value Assessment
At the entry level, BeProfit costs approximately $0.11/order (99/900 orders). This per-order cost decreases at higher tiers but can still add up for high-volume stores.
The pricing makes sense for brands that:
- Process fewer than 1,700 orders monthly
- Operate on multiple platforms
- Have minimal Google Ads spend
- Need basic profit visibility rather than certified financials
When BeProfit Makes Sense
Despite its limitations, BeProfit fills a specific niche effectively:
Multi-Platform Consolidation
BeProfit offers multichannel profit reporting for merchants selling through multiple storefronts and marketplaces. For brands selling across multiple platforms, this consolidation has real value.
Meta-Focused Advertisers
For merchants spending primarily on Meta, BeProfit offers ad integrations. Reconcile imported Meta spend with the advertising account before relying on profit figures.
Budget-Conscious Merchants
At $49- 99/month, BeProfit is significantly more affordable than enterprise analytics solutions. For early-stage brands that need basic profit visibility, the app delivers core functionality at accessible price points.
Simple Cost Structures
Brands with stable COGS that do not change frequently can manage BeProfit's manual cost input requirements without excessive administrative burden.
When to Consider Alternatives
Several scenarios indicate you have outgrown what BeProfit (or similar app-based tools) can provide:
Your Google Ads Spend Needs Reconciliation
If imported Google Ads costs differ materially from actual spend, profit calculations may be unreliable until the discrepancy is resolved.
Finance, Marketing, and Operations Present Different Numbers
App-based tools may not provide the governed metric definitions needed across departments. When finance and marketing calculate customer acquisition cost (CAC) differently, the organization needs a consistent definition. This is where a certified data foundation with a semantic layer becomes valuable.
You Need Board-Ready Financials
BeProfit provides operational visibility rather than a dedicated financial reporting system. If the business is presenting to investors or preparing for M&A, it needs a contribution margin (CM) that is defined once and consistent everywhere.
Manual COGS Updates Are Breaking Down
As SKU counts grow and costs fluctuate, maintaining accurate COGS in BeProfit can become increasingly time-consuming. The lack of automated cost synchronization from inventory systems can create data hygiene issues.
You Are Making Million-Dollar Decisions
When ad budgets, inventory investments, and expansion decisions involve significant capital, the accuracy of certified ecommerce analytics becomes material.
What $10M+ Shopify Brands Actually Need
For brands that have scaled beyond $10M in annual revenue, the profit tracking challenge changes fundamentally. The question shifts from "what is my profit?" to "can I trust this number enough to make a significant investment decision?"
The Problem With App-Based Profit Tracking at Scale
Before choosing an app-based reporting tool, evaluate these potential limitations:
- Governed definitions: Whether finance and marketing use consistent definitions of revenue, costs, and profitability
- Data validation: Whether figures can be tested against independently verified results
- Audit trails: Whether changes to cost inputs are tracked and documented
- Integration depth: Whether the tool supports the ERP, 3PL, and other systems the business uses
The importance of these controls generally increases with reporting complexity and business scale.
How Saras iQ Approaches the Problem Differently
Saras iQ is built as an AI Data Team for Shopify brands at $10M to $500M+. Rather than layering profit calculations on top of raw platform data, iQ starts with a certified data foundation:
- Context Layer: Business logic, metric definitions, and exclusion rules are encoded once. When someone asks about contribution margin, they get the same answer regardless of whether they are in finance, marketing, or operations.
- Validation Layer: iQ tests against a golden set of 30-100 client-specific questions, achieving 90%+ accuracy before deployment. Every change is regression-tested.
- 200+ Native Integrations: Beyond Shopify, Saras iQ's data foundation supports data from Amazon, TikTok Shop, Walmart, wholesale channels, NetSuite, Klaviyo, Recharge, and 3PLs through Saras Daton, the ELT layer that integrates data across sources.
- AI Data Analyst: iQ MCP connects to Claude, so users can ask questions such as "why did margin drop 2% last week?" and explore the product, channel, and geography drivers using governed business data.
The True Classic Case Study
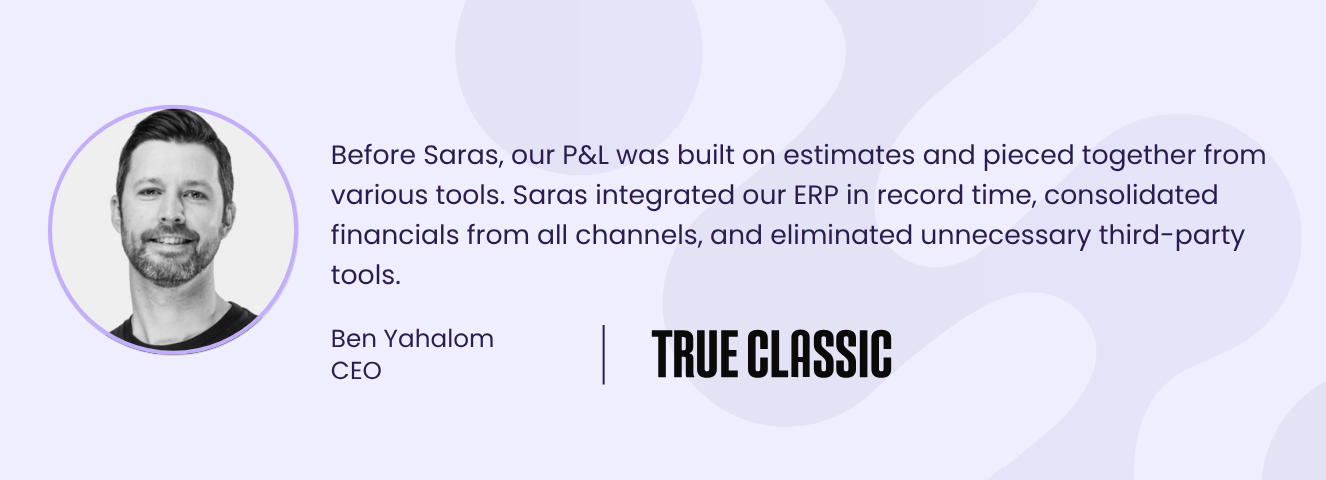
True Classic, a fast-growing apparel brand, partnered with Saras Analytics to improve fulfillment cost visibility and accuracy. Saras centralized logistics cost data from NetSuite, SFTP, and Google Drive, standardizing cost calculations across fulfillment partners. This helped the brand reduce logistics errors by 65%, cut manual effort by 90%, and save $49,000 through shipping and operational improvements.
iQ Essentials: Right-Sized for $10- 50M Brands
iQ Essentials starts at $1,999/month and includes:
- Contribution margin analytics with standardized net sales, COGS, fulfillment, platform fees, and marketing costs
- Customer analytics with Recency + Monetary segmentation and cohort analysis
- Sales and marketing analytics with standardized paid-media grouping
- iQ Chat, iQ Data Engineer (for data ops questions in Slack), and iQ MCP for Claude
- Data refresh nightly with certified accuracy
The full iQ Essentials implementation takes approximately three weeks and provides a governed data foundation rather than a standalone Shopify app.
The assisted trial covers Sales & Marketing Analytics, CM1 contribution margin, and Customer Analytics. Qualified brands connect their applicable sales, advertising, and subscription platforms and provide six business inputs. CM2/CM3, SKU-level costs, wholesale analytics, and sales targets are excluded until paid conversion; the trial does not require committing to the $10,000 implementation fee upfront.
Head-to-Head Comparison: BeProfit vs. Saras iQ
The tools serve different segments. BeProfit offers operational profitability reporting for merchants who want to consolidate costs and sales data. Saras iQ serves Shopify brands that need certified analytics and consistent metric definitions across departments.
Choosing Between BeProfit and Saras iQ for Profit Analytics
BeProfit and Saras iQ address different reporting needs. BeProfit offers order- and product-level profit visibility through a Shopify app, with published pricing from $49 to $249 per month.
Saras iQ is designed for Shopify DTC brands generating $10M+ annually that need consistent definitions and certified analytics across business functions.
When evaluating the two, consider:
- Advertising reconciliation: Check whether imported costs match Google Ads, Meta, and other source accounts.
- Cost management: Determine how COGS, shipping, fees, and refunds are maintained and validated.
- Reporting scope: Assess whether operational profit dashboards are sufficient or governed contribution margin, customer cohorts, and sales and marketing analytics are required.
- Implementation: Compare the configuration needed for BeProfit with iQ Essentials' approximately three-week implementation.
- Budget and scale: Match each platform's pricing, order limits, and reporting controls to the business's requirements.
For qualified Shopify DTC brands, Saras iQ offers a 30-day human-assisted trial using their own data. Request an assisted trial through Saras to evaluate sales, CM1 contribution margin, and customer analytics before committing to the upfront implementation fee.
Request your 30-day free trial.