.webp)
About
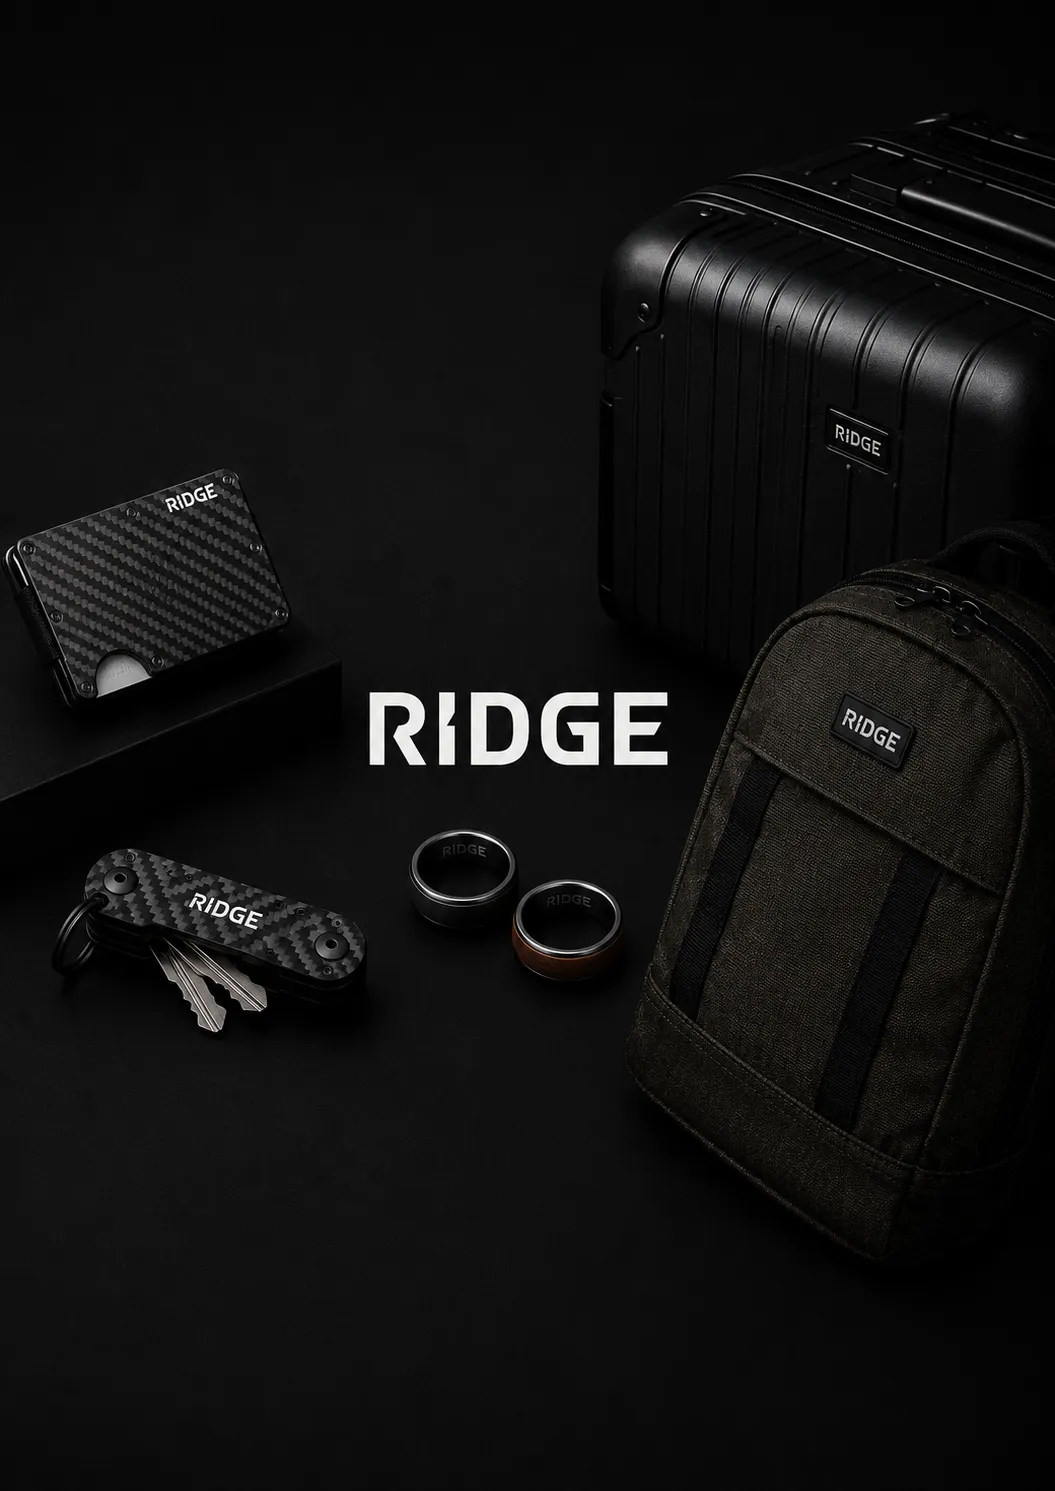
Ridge is a nine-figure DTC brand that makes slim wallets and everyday carry gear. The business runs across paid media, product, sales, profitability, customer cohorts, and forecasting. It operates internationally with a large and growing catalog.
.webp)

The Challenges
As Ridge scaled, the gap between data and decisions kept growing. Four things were slowing them down.
- Reporting was slow and manual. Every week, team members pulled metrics from dashboards by hand, built presentation decks, and sent them around. By the time the data reached the right people, the moment to act had often passed.
- Deep analysis was bottlenecked. Portfolio mix, bundle performance, and pricing questions had to be queued behind analyst capacity. Some analyses took 10 days. The business had often moved on by then.
- Teams had no shared reporting surface. Paid media, product, and operations each drew from different views of the same data. This produced conflicting numbers and slow decisions.
- Metric definitions weren't standardized. Different teams defined revenue, margin, and cohort metrics differently. Nobody trusted the numbers.
The Solution
Saras Analytics connected Ridge's existing Saras iQ data foundation to the Saras IQ MCP server. This gave every team member, from performance marketers to senior leaders, access to data answers in minutes.
The work included:
- Encoding Ridge's business rules, product taxonomy, and metric definitions into the MCP server so queries return results Ridge's team can trust.
- Building a reusable prompt template for weekly business reviews. This replaced hours of manual dashboard screenshots and deck assembly with AI-produced reports ready to distribute.
- Enabling unified paid media reporting. The paid media team now combines business metrics from Saras iQ with attribution data from Northbeam in a single report, produced by AI.
- Opening up on-demand portfolio analysis. Questions about product mix, bundling, and pricing now get answered in under an hour.
- Establishing one metric layer for the whole company. Finance, marketing, product, and operations all draw from the same source.
- Setting up a continuous feedback loop so AI responses are checked against known answers and accuracy improves over time.
The Outcomes
The 45-minute turnaround is the headline. But the shift underneath it is bigger.
- Analysis turnaround went from 10 days to 45 minutes, roughly 320 times faster, on work that previously required analyst queues.
- Manual weekly decks are gone. Reports are now produced by AI and ready to distribute.
- The AI colleague is active across paid media, product, leadership, and functional teams including email and operations.
- The entire organization works from one version of the data. Conflicting reports are no longer a problem.
- Team time shifted away from data extraction and deck building toward actual decisions.
Ridge is now building toward automated report delivery and broader access across more functions.







.webp)
.webp)



.webp)

.avif)

.avif)
.avif)
.avif)






.png)

.avif)
%20(1).avif)
.avif)

.jpg)